
Full Text
K Suozzo1 C Navitsky2 J Sutherland3*
1Town of Bolton Consultant, Lake Shore Drive, Bolton Landing, NY, USA2The Lake George Waterkeeper, Lake George, NY, USA
3Scientific Advisor, The Lake George Association, Main Street, Greenwich, NY, USA
*Corresponding author: J Sutherland, Scientific Advisor, The Lake George Association, 166 Main Street, Greenwich, NY 12834, USA, Email : jwsinack@comcast.net
Eutrophication can be accelerated by excess amounts of reactive Nitrogen (Nr) entering aquatic ecosystems. Historically, the circa 1960 Bolton Wastewater Treatment Plant, Warren County, New York (USA), discharged plant effluent for final polishing to natural sand infiltration beds, which entered the groundwater and then tributaries to Lake George. The absence of a denitrification unit process at the Bolton facility resulted in the construction of a woodchip bioreactor and a corresponding demonstration project to evaluate denitrification of plant effluent prior to sand bed discharge. This Denitrifying Bioreactor (DNBR) installation was the first real time, in-situ application of this “green technology” for a small wastewater treatment plant world-wide. The Bolton DNBR reduced nitrate-nitrogen concentrations in the tertiary effluent by 38% when compared with untreated tertiary effluent. Here we show that wastewater denitrification using this passive, environmentally compatible technology offers a low-cost, effective tool for small community wastewater treatment plants where excess Nr is problematic. Combined with diligent plant operator attention, this innovative treatment should move beyond concept into full scale field applications for other small community wastewater treatment plants globally, using lessons learned at the Bolton facility.
Woodchip bioreactors; Wastewater treatment; Reactive nitrogen; Nitrogen cascade
Nitrogen (N) is an essential element for all plants, animals, and humans. N compounds in nature are classed into nonreactive and reactive [1]. N2 is non-reactive and requires significant thermal or microbial energy to break the bond. All active N compounds in Earth’s atmosphere and biosphere are labeled reactive N (Nr) and include inorganic reduced forms (ammonia [NH3], ammonium [NH4]), inorganic oxidized forms (nitrous oxide [N2O], nitric acid [HNO3], nitrogen dioxide [NO2], nitrate [NO3-]), and organic compounds (proteins, amines, urea, nucleic acids).
Nr levels have increased significantly world-wide from increased fertilizer application to feed a rapidly expanding population and the burning of fossil fuel [2]. Once the N2 triple bond is broken, the created Nr distributes throughout the Earth’s biogeochemical pathway and produces multiple effects, magnified in time, in atmospheric, terrestrial, freshwater, and marine ecosystems, termed the nitrogen cascade [1].
Eutrophication in aquatic ecosystems is defined as an increase in the rate of organic matter and simultaneous increases in primary production [3]. Although eutrophication is not necessarily problematic because nutrients are required for growth and reproduction, it becomes an issue when excessive nutrients are discharged to a receiving waterbody.
Nitrogen and phosphorus in aquatic systems usually are in limited supply. However, if discharged to receiving waters in excess, phytoplankton species most capable of nutrient assimilation will out-compete phytoplankton species that depend on other factors for successful growth and development [4]. Continuous nutrient delivery can result in specific selection of phytoplankton, such as cyanobacteria, that ultimately affect higher ecosystem levels [5].
The Bolton WWTP, located on the west side of Lake George (New York, USA), has two sets of sand infiltration beds for effluent disposal and two tributary watersheds are affected by groundwater movement from the facility depending upon which sand beds are used. Calculations performed using recent and historical data showed that 54 tonnes of nitrate-nitrogen (NO3-N) was released to Lake George during 50 years of WWTP operation [6].
The Town of Bolton dealt with the excess nitrogen issue by constructing a woodchip bioreactor to treat tertiary plant effluent prior to sand bed discharge. Similar DNBRs have been evaluated successfully for several decades in agriculture [7,8] and aquaculture [9,10]. A thorough literature review did not find any examples of DNBR technology used to process effluent from a small community treatment plant, so this report was the first world-wide application of this technology. The successful use of this “green” technology for wastewater treatment in the Northeast US with its variable environmental conditions could lead to widespread application globally where Nr scenarios occur that are similar to Lake George.
The Bolton WWTP
The Bolton WWTP (circa 1960) was constructed with a grit chamber, Imhoff tank, trickling filter, secondary clarifiers, and sand infiltration beds (“lower” beds 1-5). In 1973, four additional infiltration beds were constructed above the plant (“upper” beds 6-9), and in 1984, two additional beds (10, 11) were constructed adjacent and south of the 1973 beds (SM Figure S1).
The Bolton WWTP was built on a series of stepwise deltaic glacial deposits to utilize the sand as infiltration substrate for treated wastewater effluent [11]. The area subsurface geology included a ridge of bedrock that bisected the lower sand beds so that groundwater flow derived from effluent disposed to these beds moved in two directions, either south toward the Mohican Road Tributary or north toward Stewart Brook (SM Figure S2). Effluent discharged to the upper sand beds entered the groundwater and moved down-gradient to Stewart Brook [11].
Impact of the Bolton WWTP on local tributaries
The effect of the Bolton WWTP on groundwater and local tributary watersheds was monitored from April 2016-May 2017 (see SM text) with a Final Report issued in June 2017 [6]. The results corroborated findings from previous studies that treatment plant effluent discharged to sand beds for final polishing contained elevated NO3-N concentrations which entered the local groundwater and flowed down-gradient into the two tributary watersheds [12-14].
Using historical [12-14] and 2016-2017 data, the NO3-N load to Lake George via the Mohican Road Tributary during the 50-year period since the earliest tributary study [12] was estimated at 50 tonnes. With no historical data for Stewart Brook, the 2017 Final Report used mean tributary flow (4,073 m3/day) and mean NO3-N concentration (1.22 mg/L) to calculate a daily load of 4.97 kg of NO3-N entering Bolton Bay (1.814 tonnes/yr).
Following release of the 2017 Final Report, the Town of Bolton passed a resolution that discontinued lower sand beds use for effluent disposal except for emergencies when the upper beds could not be used. This action immediately reduced the high NO3-N load entering the Mohican Road Tributary and part of the load entering Stewart Brook from the lower beds. The Town of Bolton then applied a local grant to design, receive permit approval and install a woodchip bioreactor in an inactive upper sand bed.
Design and installation of the woodchip bioreactor
Co-author KS designed the bioreactor (SM Figure S3+SM text). Sand bed #10 was used as the bioreactor installation site (SM Figure S1). Construction occurred between July and October 2018 when the unit became operational. The unit was not designed to process the maximum daily flow permitted through the plant, so tertiary effluent, either treated or untreated by the bioreactor, is discharged to the upper sand beds for final disposal and enters the groundwater, moving down-gradient to Stewart Brook.
Evaluation of the denitrifying woodchip bioreactor
A monitoring program (SM text) was implemented to evaluate the effectiveness of DNBR technology to reduce the NO3-N concentration in plant effluent. Sample collection and processing were carried out according to protocol (SM text) and submitted to a laboratory certified for the New York permit operating requirements that regulate this treatment facility.
Effect of the Bolton WWTP on the Stewart Brook watershed
The Stewart Brook watershed includes the upper sand bed portion of the Bolton WWTP and received continuous groundwater flow from this area during bioreactor operation. The March 2019-May 2021 study sampled Stewart Brook above and below the channel where groundwater from the upper sand beds emerges as surface water (SM Figure S4 ) . The purpose of the study was to collect data to evaluate the impact of the bioreactor on reducing the NO3-N load to Stewart Brook and Lake George.
Evaluation of woodchip bioreactor
The study period was 805 days, from March 19, 2019, through May 31, 2021. The bioreactor was in full operation for 756 days, and was offline and not treating wastewater for 49 days, or 6% of the study period. There were 77 days (~10%) of the 756 operational days during which the in-line flow meter was not recording, although the bioreactor was treating influent wastewater. The bioreactor flow data during the study are summarized (SM Table S4). Data reported here focused on the capacity of the woodchip bioreactor to (1) reduce Nr in Bolton WWTP effluent, and (2) to reduce the loading of Nr to Stewart Brook.
Physical characteristics:
Temperature: This is an important property of wastewater influent entering the bioreactor due to its effect on NO3-N removal efficiency. The mean temperatures of the bioreactor influent and effluent were 13.5°C and 13.9°C, respectively, and the bi-weekly data are plotted (Figure 1).
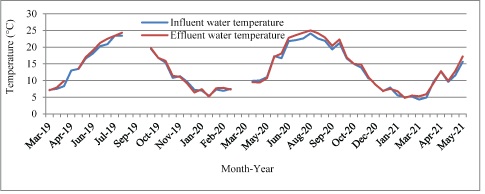
Figure 1: Woodchip bioreactor influent and effluent water temperatures, March 2019-May 2021.
NO3-N removal efficiency is greater with warm temperatures and lower with cold temperatures. Influent and effluent temperatures are similar to outside temperature because the Bolton WWTP process tanks are outside or in unheated shelters. Coupled with low temperature is the hypothesis that reduced activity by cellulolytic bacteria in the wood chips adversely impacts the removal efficiency by reducing the availability of a carbon source.
Flow: Flow was totaled daily and related to wastewater retention time in the bioreactor. The mean daily flow through the unit was 275.96 m3/day with a high flow of 450.26 m3/day on November 29, 2019, and a low flow of 114.04 m3/day on March 17, 2021.
A plot of daily wastewater flow from November 2019 through May 2021 is presented in Figure 2.
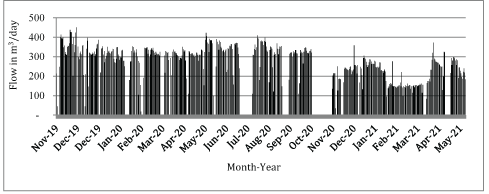
Figure 2: Daily wastewater flow through the bioreactor, November 2019-May 2021.
Beginning in November 2020, daily flows through the unit were reduced to optimize denitrification with greater retention time during a period when higher influent NO3-N concentrations and colder temperatures were observed (Figure 1). The bioreactor was not designed to process all facility wastewater flow permitted for 1,135.62 m3/day.
A comparison of total plant wastewater flow and flow through the bioreactor during the period from November 2019 through May 2021 is summarized in Figure 3.
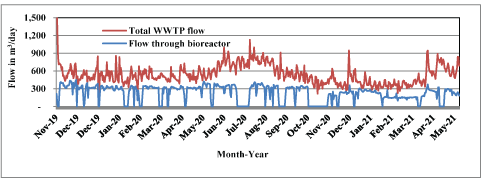
Figure 3: Total daily wastewater flow through treatment plant and bioreactor, November 2019-May 2021.
Bioreactor flow and retention time are indirectly related, and retention time influences the extent of denitrification. Retention time was manually adjusted to accommodate NO3-N concentration and influent wastewater temperature. Data showed that high effluent NO3-N levels could result from higher flows through the bioreactor, and bioreactor retention time was a focus of daily operation, having to factor in flows through the WWTP and variables such as influent NO3-N concentrations and temperature.
Chemical characteristics: Chemical characteristics of the bioreactor influent and effluent are summarized in Table 1.
Table 1: Woodchip bioreactor influent and effluent water temperatures, March 2019-May 2021.
pH: All pH values were >6.0 s.u. for influent and effluent wastewater with an influent range from 6.1-7.7 s.u. and effluent range from 6.2-7.2 s.u. The mean pH for the bioreactor influent and effluent were 6.9 and 6.8 s.u., respectively. The optimum wastewater pH values for denitrification are 7.0-8.5 s.u. [15], and it was found that pH increases in denitrification as a result of the alkalinity produced [16].
Dissolved oxygen (concentration-percent saturation): Bioreactor denitrification is maximized by anoxic, or low Dissolved Oxygen (DO), conditions, preferably <0.2 mg/L [17]. Heterotrophic bacteria reduce NO3-N to N2 in the presence of an organic carbon source and low DO. Long retention time can deplete DO levels as laboratory tests have shown that the time required to deplete DO levels in DO-saturated water is about 1 h in aged, 2-yr-old woodchip media [18].
Bioreactor influent and effluent wastewater DO saturation levels are summarized in figure 4.
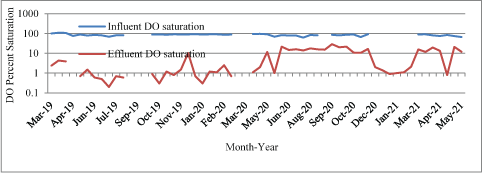
Figure 4: Bioreactor influent and effluent wastewater DO saturation, March 2019-May 2021.
The influent wastewater DO concentration and saturation ranged from 5.3 mg/L and 62.6% to 13.1 mg/L and 109.5%, with mean values of 8.9 mg/L and 85.0%, respectively. The effluent wastewater DO concentration and saturation ranged from 0.02 mg/L and 0.2% to 8.03 mg/L and 75.0%, with mean values of 0.95 mg/L and 8.2%, respectively. The average reduction in wastewater DO concentration was just under 90%, from 8.9 mg/L to 0.95 mg/L and the average reduction in DO saturation was just over 90%, from 85.0% to 8.2%.
Higher influent wastewater DO concentration coincided with (1) greater bioreactor wastewater depth and was attributed to the surface being closer to the permeable filter fabric cover where oxygen exchange could occur, and (2) winter when wastewater temperature was low allowing increased DO concentrations.
Alkalinity: Wastewater usually is alkaline, and alkalinity concentration is important for this study where ammonia is removed by nitrification and converted to NO3-N. Aerobic bacteria can use ammonia for food and DO to convert ammonia to NO3-N. Alkalinity concentrations should be at least eight times the ammonia concentration in wastewater to adequately nitrify.
In denitrification, alkalinity is created at 3.57 g of CaCO3 (mg/L alkalinity) per gram of NO3-N reduced to N2. A good/poor nitrogen removal and short-cut nitrification/denitrification can be indicated or validated by alkalinity values and difference between influent and effluent concentrations [19]. Influent and effluent bioreactor alkalinities measured during the 2019-2021 study are shown (SM Figure S5). The mean annual alkalinity concentrations of the bioreactor influent and effluent are summarized in Figure 5.
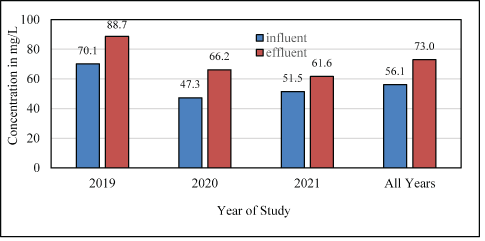
Figure 5: Mean annual bioreactor influent and effluent alkalinity concentrations, 2019-2021.
The mean alkalinity concentration in the bioreactor influent decreased between 2019 and 2020 from 70.1 to 47.3 mg/L, then increased in 2021 to 51.5 mg/L. Bioreactor effluent alkalinity exhibited a constant decrease in mean concentration from 88.7 to 66.2 to 61.6 mg/L in 2019, 2020 and 2021, respectively. The difference between the mean alkalinity of the influent and effluent was +18.6 to +18.9 to +10.1 mg/L in 2019, 2020 and 2021, respectively.
Alkalinity is lost during nitrification (ammonia changed to NO3-N) and produced during denitrification (NO3-N changed to N2). Parameters important for denitrification are anoxic conditions (DO concentration <1-2 mg/L; optimum concentration 0.2 mg/L [17]), pH (pH range7.0-8.5 s.u. [15]), temperature (optimum 20-35°C; can occur as low as 3°C [20]), and available carbon. Other variables are NO3-N concentration (high=greater availability), temperature and retention time. An increase in mean alkalinity from influent to effluent (Figure 5) indicated denitrification.
Nitrogen: Nitrogen removal from wastewater is a three-step process that includes ammonification, nitrification, and denitrification and is summarized (SM text). The nitrogen forms of concern in wastewater treatment are Total Nitrogen (TN), Total Kjeldahl Nitrogen (TKN), ammonia-nitrogen (NH3-N), Organic Nitrogen (ON), nitratenitrogen (NO3-N), nitrite-nitrogen (NO2-N) and nitrogen gas (N2). The relationships of various nitrogen forms are presented (SM text). In this study, NO3-N and NH3-N were the only nitrogen forms chemically analyzed.
The mean annual NO3-N concentrations measured at the bioreactor sampling sites from 2019-2021 are summarized in Figure 6.
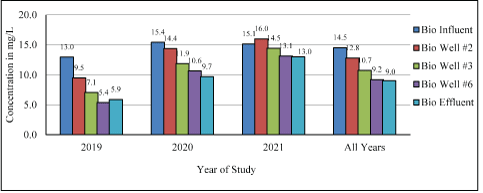
Figure 6: Mean annual wastewater NO3-N concentrations measured at bioreactor sampling sites.
A decrease of wastewater NO3-N concentration from bioreactor influent through the well sites to the bioreactor effluent indicated successful denitrification. The difference between mean annual bioreactor influent and effluent NO3-N concentration decreased over the study from 7.1 (2019) to 5.7 (2020) to 2.1 mg/L (2021), with an “All Years” mean reduction of 5.5 mg/L. The percentage of NO3-N reduction decreased annually from 54.6% (2019) to 37.0% (2020) to 13.9% (2021) with an overall “All Years” reduction of 37.9% (Figure 6).
The possible conditions that influenced bioreactor denitrification reduction over time were higher NO3-N concentrations in the wastewater influent during the study (SM Figure S8) indicating changes in wastewater characteristics. During 2020, the Bolton WWTP seasonality can be seen in the high influent NO3-N concentrations entering the bioreactor starting in late May, into mid-September, and through February 2021 (SM Figure S8). At times, the 2020 and 2021 influent NO3-N concentrations were twice the 2019 concentrations. Woodchip degradation, the carbon source, also could reduce denitrification.
We hypothesize that the decrease in NO3-N removal efficiencies during cold weather is due to insufficient available woodchip carbon. Research indicates temperature sensitivity of cellulolytic bacteria [20-22]. The organic carbon/N ratio variability as it relates to microbial denitrification has been identified [23], and others [24] have defined a BOD/NOx-N ratio of 2/3 to ensure 100% denitrification. The impact of lowered wastewater temperatures, reduced carbon source availability during cold weather due to temperature sensitivity of cellulolytic bacteria, and requisite C/N ratio for successful NO3-N reduction present key areas for future research.
The bioreactor NH3-N results are presented (SM text) with additional denitrification information.
Variability in bioreactor treatment efficiency: The percent removal of NO3-N from effluent that entered the bioreactor is summarized (Figure 7) and the overall study removal was 38%.
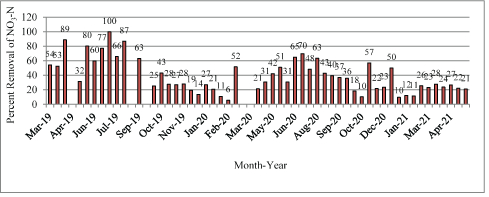
Figure 7: Percent removal of NO3-N from wastewater entering the bioreactor influent and processed by the unit, March 2019-May 2021.
The removal efficiency of NO3-N and certain operational parameters influenced the degree of denitrification including water temperature, influent NO3-N and DO concentrations, retention time, and suitable carbon source availability [25]. Factors that influenced the operational efficiency are summarized (Table S5+SM text).
Woodchip bioreactor maintenance: Bioreactor maintenance issues during operation are described in the SM text.
Woodchip bioreactor operational challenges: As a first-time, fullscale field installation, operational challenges related to the bioreactor were expected and encountered, and their resolution led to modified design, construction, operation, and monitoring of the process. See the SM section for further details.
Woodchip bioreactor shutdown due to plugging
There were several instances of bioreactor clogging of material that will reduce denitrification efficiency and possibly lead to hydraulic failure. Instances of clogging are discussed in the SM section,
Effect of the Bolton WWTP woodchip bioreactor on Stewart Brook water quality
Bolton WWTP effluent discharged to the upper sand beds enters the groundwater, moves down-gradient, and emerges as surface water in Stewart Brook (SM Figure S3). The 2016-2017 study evaluated the impact of effluent discharged to the upper beds on Stewart Brook water quality with the beds used from May to October each year. Coincident with the installation and operation of the bioreactor in October 2018, the upper sand beds were used year-round for effluent disposal and the 2019-2021 study was conducted to evaluate the water quality impact on Stewart Brook.
Stewart Brook flow and NO3-N data collected above and below the groundwater influence from the upper sand beds during the 2016-2017 and 2019-2021 studies are compared (Table 2). Temperature and DO percent saturation data collected during 2019-2021 also are presented (SM section) as additional evidence of the groundwater influence on Stewart Brook.
Table 2: Woodchip bioreactor influent and effluent water temperatures, March 2019-May 2021.
Flow: Flow variability between the two studies (Table S9+SM text) highlights the different annual precipitation amounts and patterns that occur. Bi-weekly flow measured during the 2019-2021 study demonstrates the seasonal nature of this tributary (SM Figure S12). The difference in flow between the above and below stations is attributed to the continuous discharge of effluent from the WWTP to the upper sand beds entering Stewart Brook. The greatest flow difference between these stations occurred during the late spring-summer-early fall each year when daily wastewater volume entering the plant increased due to local seasonal tourism.
Nitrogen: The mean NO3-N concentrations measured above and below the groundwater intrusion into Stewart Brook during the 2016-2017 and 2019-2021 studies were summarized (Table 2). The mean NO3-N concentration increased from 0.08 to 0.12 mg/L at the above site between the two studies. The below site exhibited a 72% increase (2.01 to 3.45 mg/L) when comparing the two studies, with the increase due to continuous effluent disposal to the upper sand beds.
The NO3-N concentrations measured above and below on Stewart Brook during 2019-2021 are shown in Figure 8. The NO3-N concentration at the below site increased in late spring, summer, and early fall when area tourism and wastewater volumes increased, followed by lower concentrations during winter when tourism and wastewater volumes decrease. The Bolton WWTP inability to achieve effective denitrification during high volume is evident (Figure 8).
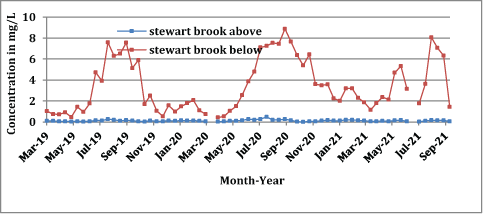
Figure 8: NO3-N concentrations measured at above and below stations on Stewart Brook, 2019-2021.
Effect of the woodchip bioreactor on NO3-N loading to stewart brook: Prior to the 2017 Town of Bolton mandate banning lower sand bed use, disposal of WWTP effluent alternated between lower and upper beds. After October 2018, the upper sand beds were used almost continuously for effluent disposal except for an occasional emergency.
Here, we characterize (1) NO3-N loading to Stewart Brook from the upper sand beds prior to woodchip bioreactor construction, and (2) the woodchip bioreactor influence on reducing the NO3-N concentration entering Stewart Brook compared with untreated effluent discharged directly to the upper beds with no treatment from the denitrifying bioreactor.
Table 3 presents the mean NO3-N concentration in plant effluent and bioreactor effluent, mean plant flow, and duration of upper sand bed use in the 2016-2017 and 2019-2021 studies to demonstrate the ability of the woodchip bioreactor to reduce NO3-N load to Stewart Brook.
Table 3: Woodchip bioreactor influent and effluent water temperatures, March 2019-May 2021.
The highest daily NO3-N load (11.92 kg/day) occurred during the 2016-2017 study with a mean NO3-N concentration of 17.5 mg/L in plant wastewater effluent. Post-2017 facility processing improvements achieved a 17% decrease in mean wastewater effluent concentration (to 14.5 mg/L) leading up to the 2019-2021 study. Woodchip bioreactor construction and treatment of plant effluent resulted in a 38% decrease in wastewater effluent concentration (to 9.02 mg/L), the lowest daily load of the various scenarios. Inability of the bioreactor to treat all daily plant flow resulted in the convergence of treated bioreactor effluent with tertiary treated plant effluent to form the “bed effluent” (Table 3) with a mean NO3-N concentration (11.9 mg/L) intermediate between the untreated plant effluent and treated bioreactor effluent, and an 18% decrease from tertiary effluent leaving the plant untreated by the bioreactor.
These data clearly highlight bioreactor effectiveness in reducing the NO3-N load to Stewart Brook even though all daily Bolton WWTP effluent could not be processed through this unit. During the 756-day period of woodchip bioreactor operation, effluent discharged from the Bolton WWTP without unit operation would have contributed a NO3-N load of 9.63 kg/day, or 7.3 tonnes to Stewart Brook. The contribution of the bioreactor operating during this 756-day period reduced the NO3-N load to Stewart Brook by 18% to 7.90 kg/day, or 6.0 tonnes.
The material presented here provides compelling evidence that denitrifying woodchip bioreactor technology has a beneficial application in small community wastewater treatment plants with are active nitrogen issue. This “green” sustainable technology can provide a low cost and effective treatment for situations similar to Lake George where continuous loading of Nr to local groundwater or tributaries occurs. Locations with climate similar to the Northeast US can expect better denitrification during warmer months and reduced denitrification during colder months. The biggest factor affecting the success of the current project was operator involvement on a continuous daily basis. Other installations similar to Lake George can take ‘lessons learned” from the Bolton WWTP to guide efforts toward a successful outcome in wastewater management.
The authors extend a special acknowledgement to Town of Bolton Supervisor Ronald Conover. This study would not have been implemented without his leadership and determination to deal with an adverse situation and advocate for the water quality of Lake George. The authors also extend their appreciation to Matt Coon, Chief Operator, and Justin Persons, Assistant Operator, Town of Bolton WWTP.
The 2019-2021 study was conducted using federal funds under NA18OAR4170099 to the Lake Champlain Sea Grant from the National Oceanic and Atmospheric Administration National Sea Grant College Program, U.S. Department of Commerce. The statements and findings are those of the authors and do not necessarily reflect the views of Sea Grant, NOAA, or the U.S. Department of Commerce.Funds also were provided by The FUND for Lake George (FUND) and The Lake George Association (LGA). The FUND The LGA provided in-kinds services, which allowed the participation of Chris Navitsky, The Lake George Waterkeeper and Brea Arvidson, LGA Manager of Water Quality Research in the monitoring program. The Town of Bolton provided in-kind services, which allowed the participation of Bolton WWTP Chief Operator Matt Coon, Assistant Operator Justin Persons, and Town Engineer Kathleen Suozzo.
- Galloway JN, Aber JD, Erisman JW, Setzinger SP, Howarth RW, et al. (2003) The Nitrogen Cascade. Bioscience 53: 341-356.[Ref.]
- Erisman JW, Galloway JN, Seitzinger S, Bleeker A, Dise NB, et al. (2013) Consequences of human modification of the global nitrogen cycle. Philos Trans R Soc Lond B Biol Sci 368: 20130116. [Ref.]
- Nixon SW (1995) Coastal marine eutrophication: a definition, social causes, and future concerns. Ophelia 41: 199-219. [Ref.]
- Rabalais NN, Turner RE, Díaz RJ, Justić D (2009) Global change and eutrophication of coastal waters. ICES J Mar Sci 66: 1528-1537. [Ref.]
- Dolman AM, Rücker J, Pick FR, Fastner J, Rohrlack T, et al. (2012) Cyanobacteria and Cyanotoxins: the Influence of Nitrogen versus Phosphorus. PLoS One 7: e38757. [Ref.]
- Sutherland JW, Navitsky C (2017) Final Report. Bolton Bay (Lake George, Warren County) Water Quality Assessment. A Monitoring Program to Evaluate Current Water Quality Issues. Prepared for The Fund for Lake George and the Town of Bolton: Lake George, New York, 150 pp, + appendices.
- Christianson LE, Bhandari A, Helmers MJ (2012) A practice-oriented review of woodchip bioreactors for subsurface agricultural drainage. Appl Eng Agric 28: 861-874. [Ref.]
- Christianson LE, Schipper, LA (2016) Moving denitrifying bioreactors beyond proof of concept: Introduction to the special section. J. Environ Qual 45: 757-761. [Ref.]
- Von Ahnen M, Bovbjerg P, Dalsgaard J (2018) Performance of fullscale woodchip bioreactors treating effluents from commercial RAS. Aquacult Eng 83: 130-137. [Ref.]
- Lepine C, Christianson L, McIssac G, Summerfelt S (2020) Denitrifying woodchip bioreactors for wastewater treatment. Hatchery Internat 1-5. [Ref.]
- Aulenbach DB, Fillip AJ (1983) The Bolton Landing rapid infiltration wastewater treatment plant. In The Lake George Ecosystem, Volume III, Lake George, New York, Carol Desormeau Collins, Ed: The Lake George Association, Lake George, New York, 101-109.
- Fuhs GW (1972) The Chemistry of Streams Tributary to Lake George, New York. New York State Department of Health, Environmental Health Report No. 1; Albany, New York.
- Keppler D (2008) 2007 Stream Assessment Report. The chemical, physical, and biological data collected in 47 stream sample sites throughout the Lake George watershed. Prepared for The FUND For Lake George, Lake George, New York, 50 pp, + appendices.
- Keppler D (2009) 2008 Stream Assessment Report. The Chemical, Physical, and Biological Data Collected from 52 Stream Sampling Sites throughout the Lake George Watershed. Prepared for The FUND For Lake George, Lake George, New York, 69 pp, + appendices.
- Dangcong P, Yi W, Hao W, Xiaochang W (2004) Biological denitrification in a sequencing batch reactor. Water Sci Technol 50: 67-72. [Ref.]
- Mokhayerei Y (2010) Characterizing Denitrification Kinetics and Stoichiometry At Different Temperatures Using Various Carbon Sources. Ph. D. Dissertation, The School of Engineering & Applied Science, The George Washington University, Washington, D.C.
- Seitzinger S, Harrison JA, Bohlke JK, Bouwman AF, Lowrance R, et al. (2006) Denitrification across landscapes and waterscapes: a synthesis. Ecol Appl 2064-2090. [Ref.]
- Robertson WD, Merkley LC (2009) In-stream bioreactor for agricultural nitrate treatment. J Environ Qual 38: 230-237. [Ref.]
- Li B, Irvin S (2007) The comparison of alkalinity and PRP as indicators for nitrification and denitrification in a sequencing batch reactor (SBR). Biochem. Eng J 34: 248-255. [Ref.]
- Holt DM, Jones EB (1983) Bacterial degradation of lignified wood cell walls in anaerobic aquatic habitats. Appl Environ Microb 46: 722-727. [Ref.]
- Desvaux M (2006) Unravelling carbon metabolism in anaerobic cellulolytic bacteria. Biotechnol Progr 22: 1229-1238.[Ref.]
- Jang J, Anderson EL, Venterea RT, Sadowsky MJ, Rosen CJ, et al. (2019) Denitrifying bacteria active in woodchip bioreactors at lowtemperature conditions. Front Microbiol 10: 635. [Ref.]
- Sobieszuk P, Szewczyk KW (2006) Estimation of (C/N) ratio for microbial denitrification. Environ Technol 27: 103-108. [Ref.]
- Narkis N, Rebhun M, Sheindorf CH (1979) Denitrification at various carbon and nitrogen ratios. Water Res 13: 93-98. [Ref.]
- Schipper L, Robertson W, Gold A, Jaynes D, Cameron S (2010) Denitrifying bioreactors-An approach for reducing nitrate loads to receiving waters. Ecol Eng 36: 1532-1543. [Ref.]
Download Provisional PDF Here
Download Provisional Supporting Material Here
Article Type: RESEARCH ARTICLE
Citation: Suozzo K, Navitsky C, Sutherland J (2022) First Demonstration of Nitrate Reduction Using Woodchip Bioreactor Technology at a Small Community Wastewater Treatment Plant. Int J Water Wastewater Treat 8(2): dx.doi.org/10.16966/2381-5299.186
Copyright: © 2022 Suozzo K, et al. This is an open-access article distributed under the terms of the Creative Commons Attribution License, which permits unrestricted use, distribution, and reproduction in any medium, provided the original author and source are credited.
Publication history:
SCI FORSCHEN JOURNALS
All Sci Forschen Journals are Open Access
