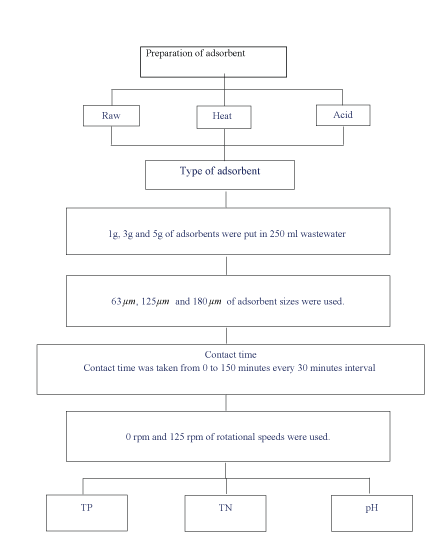
Figure 1: Experimental procedure for nutrient removal.


Nur Adilah Mohd Salim Azilah Ajit* Aishath Naila2 Ahmad Ziad Sulaiman2
Faculty of Chemical and Natural Resources Engineering, Universiti Malaysia Pahang, Lebuhraya Tun Razak, 26300 Gambang, Kuantan, Pahang, Malaysia*Corresponding author: Azilah Ajit, Faculty of Chemical and Natural Resources Engineering, University Malaysia Pahang, Lebuhraya Tun Razak, 26300 Gambang, Kuantan, Pahang, Malaysia, Tel: +60199710201; E-mail: azilahajit@ump.edu.my
The increasing of nutrients in wastewater from petrochemical industry is mostly difficult to handle. Particularly, wastewater from this industry contains high level of nitrogen and phosphorus which may lead to eutrophication of algae bloom. In order to fully utilize the waste of bauxite (red mud) rather than to let it dumped to landfill without any treatment, a study was conducted to investigate the potential of red mud for nitrogen and phosphorus removal in petrochemical industry wastewater. The red mud (adsorbent) was modified with three different treatments; raw, heat-treatment and acid-treatment. Then, the adsorbent was characterized using Scanning Electron Microscopy (SEM). The maximum adsorption of nitrogen and phosphorus was observed by acid-treatment adsorbent; 68.75% and 63.16%, respectively. The equilibrium time was attained after 100 minutes. The highest removal percentage of nitrogen and phosphorus were achieved at adsorbent dosage 5 g/L with adsorbent size of 63 µm and inclusive rotational speed. SEM analysis found that morphology of pores increases when the adsorbents were treated with different treatment. Acid-treatment adsorbent was observed as an efficient and cost-effective adsorbent for selective removal of nitrogen and phosphorus in aqueous solutions.
Nutrients removal; Adsorption; Red mud; Petrochemical industry; Nitrogen and phosphorus
Wastewaters from the petrochemical industries contain complex mixture of toxic obstinate organic and inorganic chemicals including high level of nitrogen and phosphorus [1]. Phosphorus and nitrogen are essential nutrients for the growth of photosynthetic algae and other biological organisms in water bodies and cause eutrophication. In the petrochemical industry wastewater total nitrogen and total phosphorus ranges between 4.4-18 mg/L and 2.5-3.7 mg/L, respectively [2].
Wastewater is treated by physical, chemical and biological methods. Physical methods are ineffective and expensive in wastewater treatment. For example, only 10% of phosphorus is removed by electrolysis and reverse osmosis [3,4]. Ammonia stripping [5] and ion exchange [6] are chemical methods and biological methods include nitrification and denitrification [7,8]. Enhanced biological treatment can remove up to 97% of the total phosphorus and it is low-cost. But the variability in chemical composition and temperature of wastewater would make the implementation of this process not feasible for wastewater treatment [9].
The total nitrogen (TN) content of wastewater is often referred to as the Total Kjeldhal Nitrogen (TKN), according to the technique by which it is determined. However, it is important to emphasise that TKN measurement gives the amount of organic nitrogen plus ammonium nitrogen, but excludes most of the nitrate-nitrogen which is lost during digestion [10]. In industrial wastewater, sources of nitrogen might come from catalyst regeneration and ammonia production.
Adsorption is the simplest and widely used for wastewater treatment due to its easy and cheap operation cost [11]. Recent studies have focused on the usage of low-cost adsorbent in order to minimize the processing costs of the effluents. There are many industrial wastes which have the potential to be a lowcost adsorbent [12]. For example, red mud (bauxite residue) was found a low cost adsorbent and was found an effective to remove phosphorus in wastewater [13].
Red mud is an industrial waste generated during the production of alumina (Al2O3) [14]. Every year 150 metric tons of red mud is produced globally [13]. As a solid waste, red mud is usually disposed in mud lakes in the form of slurry impoundment or stack in ponds as dry mud near alumina plants or directly discharged through a pipeline into a nearby sea. This is because the disposal cost of red mud is expensive which about 5% of alumina production. Studies on the physical and chemical properties and comprehensive utilization of red mud have become a focus of related materials within science and engineering fields [15]. Therefore, instead of discarding red mud as a waste it could be utilized for beneficial purposes.
Bauxite mining has become a controversial political issue in Kuantan due to environmental pollutions. The extensive and uncontrolled mining activities will generate abundant of untreated red mud waste. Moreover, these activities cause adverse impacts on the environment, health and quality of life of the people living in the affected areas. Although red mud waste may give bad impact but due to its special character, it can be used as an adsorbent. A few studies have been done by researchers on removal of phosphorus by using red mud. However, there is no such study for removal of nitrogen and phosphorus simultaneously. It motivates us to conduct a research on removal of these nutrients by using red mud as an adsorbent.
The main focus of this study is to remove nutrients from the wastewater. These nutrients are the sources for the aquatic plants to grow. Excessive nutrients may lead to algae bloom or known as eutrophication. Therefore, red mud will be used in this study due to its capability to remove those nutrients. Apart of that, abundant of red mud waste has not been fully utilize and its wastes are mostly dumped to the landfill without any treatment and thus results in pollution [14]. Moreover, the cost to dispose the red mud is expensive, which is about 2% of the alumina price [16]. Red mud can be used in several aspects due to its unique physical and chemical properties. One of the applications is in wastewater treatment for removal of toxic heavy metals such as copper (Cu), zinc (Zn), cadmium (Cd) and chromium (Cr) [17]. In addition, the other applications of red mud have been further studied in many fields such as constructions [18] and ceramics [19]. In the present study, red mud has been investigated for the removal of nutrients. According to Liu, et al. [12] and Huang, et al. [20], red mud has potential for phosphorus removal. However, there is no study on removal of nitrogen by using red mud.
Thus the aim of this work was to use red mud as an absorbent to remove nitrogen and phosphorous from wastewater of petrochemical industry. The objective of this research is to investigate the potential of red mud for nitrogen and phosphorus removal in petrochemical industry wastewater. In order to achieve the objective of this work, the following scopes were identified for investigation: type of adsorbent treatment- raw, heat-treated, acid-treated, effect of adsorbent dosages of red mud on the performance of the phosphorus and nitrogen removal at 1 g/L, 3 g/L and 5 g/L, investigate effect of adsorbent sizes on the removal of phosphorus and nitrogen at 63 µm, 125 µm and 180 µm, effect of rotational speed at 0 rpm and 125 rpm on the performance of the nutrient removal, and investigate the effect of contact time from 0 to 150 min on the removal of nutrients.
Red mud was collected from Gebeng Industrial Park in Kuantan Pahang. The chemicals Potassium Phosphate Monobasic (KH2PO4) and Sodium Nitrate (NaNO3) were obtained from Sigma-Aldrich. Total phosphorus (TN) and total nitrogen (TN) was analysed using HACH spectrophotometer DR 2800. The pH reading of the solution was measured by using Metter Toledo bench top pH meter.
Wastewater preparation: Synthetic wastewater was prepared using a mixture of 10 mg/L KH2 PO4 and 3.7 mg/L of NaNO3 by dissolving 0.010g of KH2 PO4 and 0.0037g NaNO3 with 1000 mL of de-ionized water respectively.
Figure 1 shows the experimental procedure for preparation of adsorbents.

Figure 1: Experimental procedure for nutrient removal.
Figure 2 shows the flow chart of the whole process. For the first step, three types of adsorbents were prepared; raw, heattreated and acid-treated. These three types of adsorbents were used to remove phosphorus and nitrogen from the wastewater. Five factors were analysed in the experiment; type of adsorbent, dosage, particle size, contact time and rotational speed. The reading of total nitrogen (TN), total phosphorus (TP) and pH were taken at the end of the experiment in order to detect the removal of these nutrients. P and N removal were defined as shown in Equation 1:
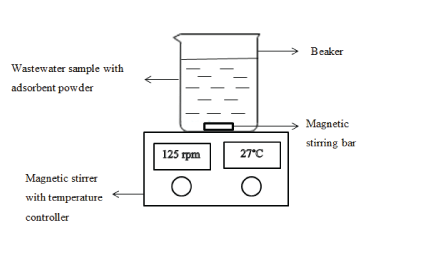
Figure 2: Schematic diagram of the experimental set up
\[\% {\rm{ }}removal = \frac{{{C_i}{\rm{ - }}{C_e}}}{{{C_i}}} \times 100\,\,\,\,\,\,\,\,\,\left( 1 \right){\rm{ }}\]
Where Ci and Ce are the initial and final concentration of P ion and N ion in the solution (mg/L).
Raw Adsorbent: First raw red mud, the wet sample, was dried inside an oven at 105°C for 24 hours to remove all moisture. Then, the dried sample was crushed into powder by using a grinder machine. Lastly, the red mud powder was sieved into 63μm, 125μm and 180μm sizes using a sieve shaker.
Acid-treated Adsorbent: The samples of red mud powder were mixed with 2M HCl (liquid/solid ratio of 20 mL/g) at room temperature for 24 hours. After acid-treatment, the residue was washed with distilled water and dried overnight at 100°C.
Heat-treated Adsorbent: Heat-treated adsorbent process was done by using a furnace. The red mud powder was placed in the ceramic crucible and heated at 700°C for 3 hours.
Total nitrogen and total phosphorus analysis: A mixture of nitrogen and phosphorus was prepared and standardized it at pH 12. Then, 3 g of raw adsorbent was mixed with the solution. The magnetic stirrer was set at 125 rpm and the solution was stirred for 150 minutes. About 10 mL of the sample was taken for each 30minutes intervals and analyzed for the phosphorus and nitrogen content. The phosphorus and nitrogen contents were determined by HACH spectrometer. The procedure was repeated for different type of adsorbents; acid-treated and heattreated adsorbent.
Optimum condition of the factors that yielded highest nutrient removal were particle size 63um, dosage 5g/L, rotational speed 125 rpm, and 90 min time (See Tables 1-3). The latter was extended till 150 minutes to confirm that no further removal occurred.
| Absorbent type | Time (min) | Phosphorus concentration (mg/l) | Nitrogen concentration (mg/l) | Phosphorus reduction (%) | Nitrogen reduction (%) |
| raw | 0 | 11.2 | 4.7 | 0 | 0 |
| 30 | 10.2 | 4.4 | 8.93 | 6.38 | |
| 60 | 8.8 | 3.9 | 21.43 | 17.02 | |
| 90 | 8.5 | 3.3 | 24.11 | 29.79 | |
| 120 | 8.3 | 3.6 | 25.89 | 23.40 | |
| 150 | 8.7 | 3.7 | 22.32 | 21.28 | |
| Heat-treated | 0 | 11.8 | 4.5 | 0 | 0 |
| 30 | 8.4 | 3.1 | 28.81 | 31.11 | |
| 60 | 6.9 | 2.2 | 41.53 | 51.11 | |
| 90 | 4.5 | 1.6 | 61.86 | 64.44 | |
| 120 | 4.6 | 1.7 | 61.02 | 62.22 | |
| 150 | 4.7 | 1.8 | 60.17 | 60.00 | |
| Acid-treated | 0 | 11.4 | 4.8 | 0 | 0 |
| 30 | 8 | 2.9 | 29.82 | 39.58 | |
| 60 | 6.3 | 1.7 | 44.74 | 64.58 | |
| 90 | 4.2 | 1.6 | 63.16 | 66.67 | |
| 120 | 4.3 | 1.5 | 62.28 | 68.75 | |
| 150 | 4.3 | 1.5 | 62.28 | 68.75 | |
| Adsorbent size 63 µm | 0 | 11.8 | 4.5 | 0 | 0 |
| 30 | 8.4 | 3.1 | 28.81 | 31.11 | |
| 60 | 6.9 | 2.2 | 41.53 | 51.11 | |
| 90 | 4.5 | 1.6 | 61.86 | 64.44 | |
| 120 | 4.7 | 1.7 | 60.17 | 62.22 | |
| 150 | 4.7 | 1.7 | 60.17 | 62.22 | |
| Adsorbent size 125µm | 0 | 11.8 | 4.5 | 0 | 0 |
| 30 | 9.8 | 3.7 | 16.95 | 17.78 | |
| 60 | 8.4 | 2.9 | 28.81 | 35.56 | |
| 90 | 7.2 | 2.3 | 38.98 | 48.89 | |
| 120 | 7.2 | 2.3 | 38.98 | 48.89 | |
| 150 | 7.2 | 2.5 | 38.98 | 44.44 | |
| Adsorbent size180 µm. | 0 | 11.2 | 4.7 | 0 | 0 |
| 30 | 10.7 | 4.4 | 4.46 | 6.38 | |
| 60 | 10 | 3.8 | 10.71 | 19.15 | |
| 90 | 9.5 | 3.1 | 15.18 | 34.04 | |
| 120 | 10 | 3.3 | 10.71 | 29.79 | |
| 150 | 10.2 | 3.5 | 8.93 | 25.53 |
Table 1: Phosphorus and nitrogen removal using adsorbent
| Time (min) | Phosphorus concentration (mg/l) | Nitrogen concentration (mg/l) | Phosphorus reduction (%) | Nitrogen reduction (%) | |
| Adsorbent dosage 5 g/L | 0 | 11.2 | 4.7 | 0.00 | 0.00 |
| 30 | 8.8 | 3.1 | 21.43 | 34.04 | |
| 60 | 7.1 | 2.5 | 36.61 | 46.81 | |
| 90 | 6.5 | 2.1 | 41.96 | 55.32 | |
| 120 | 6.1 | 1.9 | 45.54 | 59.57 | |
| 150 | 6.1 | 1.9 | 45.54 | 59.57 | |
| Adsorbent dosage 3 g/L | 0 | 11.8 | 4.7 | 0.00 | 0.00 |
| 30 | 10 | 3.5 | 15.25 | 25.53 | |
| 60 | 8.3 | 2.9 | 29.66 | 38.30 | |
| 90 | 7.6 | 2.4 | 35.59 | 48.94 | |
| 120 | 7.4 | 2.4 | 37.29 | 48.94 | |
| 150 | 7.3 | 2.5 | 38.14 | 46.81 | |
| Adsorbent dosage 1 g/L | 0 | 11.4 | 4.8 | 0.00 | 0.00 |
| 30 | 10.2 | 4.3 | 10.53 | 10.42 | |
| 60 | 9.5 | 3.8 | 16.67 | 20.83 | |
| 90 | 9.2 | 3.6 | 19.30 | 25.00 | |
| 120 | 8.7 | 3.6 | 23.68 | 25.00 | |
| 150 | 8.7 | 3.6 | 23.68 | 25.00 | |
| 0 | 11.2 | 4.7 | 0.00 | 0.00 | |
| 10 | 9.7 | 3.9 | 13.39 | 17.02 | |
| 30 | 8.8 | 3.1 | 21.43 | 34.04 | |
| 60 | 7.1 | 2.5 | 36.61 | 46.81 | |
| 100 | 6.6 | 2.2 | 41.07 | 53.19 | |
| 150 | 6.6 | 2.2 | 41.07 | 53.19 |
Table 2: Phosphorus and nitrogen removal based on time contact
| Time (min) | Phosphorus concentration (mg/l) | Nitrogen concentration (mg/l) | Phosphorus reduction (%) | Nitrogen reduction (%) | |||
| Adsorbent dosage 5 g/L | 0 | 11.2 | 4.7 | 0.00 | 0.00 | ||
| 30 | 8.8 | 3.1 | 21.43 | 34.04 | |||
| 60 | 7.1 | 2.5 | 36.61 | 46.81 | |||
| 90 | 6.5 | 2.1 | 41.96 | 55.32 | |||
| 120 | 6.1 | 1.9 | 45.54 | 59.57 | |||
| 150 | 6.1 | 1.9 | 45.54 | 59.57 | |||
| Adsorbent dosage 3 g/L | 0 | 11.8 | 4.7 | 0.00 | 0.00 | ||
| 30 | 10 | 3.5 | 15.25 | 25.53 | |||
| 60 | 8.3 | 2.9 | 29.66 | 38.30 | |||
| 90 | 7.6 | 2.4 | 35.59 | 48.94 | |||
| 120 | 7.4 | 2.4 | 37.29 | 48.94 | |||
| 150 | 7.3 | 2.5 | 38.14 | 46.81 | |||
| Adsorbent dosage 1 g/L | 0 | 11.4 | 4.8 | 0.00 | 0.00 | ||
| 30 | 10.2 | 4.3 | 10.53 | 10.42 | |||
| 60 | 9.5 | 3.8 | 16.67 | 20.83 | |||
| 90 | 9.2 | 3.6 | 19.30 | 25.00 | |||
| 120 | 8.7 | 3.6 | 23.68 | 25.00 | |||
| 150 | 8.7 | 3.6 | 23.68 | 25.00 | |||
| 0 | 11.2 | 4.7 | 0.00 | 0.00 | |||
| 10 | 9.7 | 3.9 | 13.39 | 17.02 | |||
| 30 | 8.8 | 3.1 | 21.43 | 34.04 | |||
| 60 | 7.1 | 2.5 | 36.61 | 46.81 | |||
| 100 | 6.6 | 2.2 | 41.07 | 53.19 | |||
| 150 | 6.6 | 2.2 | 41.07 | 53.19 | |||
Table 3: Phosphorus and nitrogen removal using rotational speed
Figures 3 and 4 show the effect of adsorbent treatments on the percentage removal of phosphorus and nitrogen.
From Figure 3, acid-treated adsorbent gives the highest removal of phosphorus which is 63.16%. For heat-treatment adsorbent, the result is slightly decrease compared to acidtreatment which is 61.86 %. For raw adsorbent, the percentage removal of phosphorus is obviously lower than the other two adsorbents which are 25.89 %. For heat-treated adsorbent, the high temperature treatment decomposes some organics and hydroxyl groups which are the effective sites for PO43- and NO3- adsorption. In addition, heat-treatment may also cause the sintering of particles, losing contact area for adsorbate and resulting in low adsorption capacity [20].
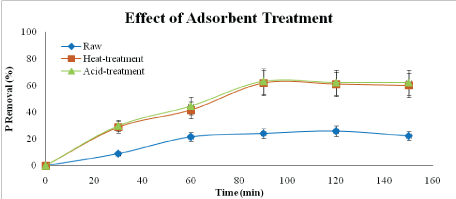
Figure 3: Effect of adsorbent type on phosphorus removal (adsorbent dosage: 5 g/L, adsorbent size: 63 µm, contact time: 150 min speed: 125 rpm)
From Figure 4, acid-treated adsorbent can remove nitrogen up to 68.75 % compared to heat-treated adsorbent and raw adsorbent which removed 64.44 % and 29.79%, respectively. Acid-treatment by HCl increases the adsorption capacity and gives the highest adsorption capacity among the other type of adsorbents. This is because acid treatments neutralize the hydroxide ions (OH-), which reduces the negative charges, on the alkaline surface of red mud [11]. The process promotes the adsorption of negatively charged PO43- and NO3- species in the solution, thus the increase of adsorption capacity can be anticipated. There is other opinion said that sample treated with acid may cause a partial loss acid-soluble fractions like hematite and calcite decrease in residue [21]. Therefore, the solubilized ferum (Fe) and aluminium (Al) retained in the residue may play an important role in the removal of PO43- and NO3- in the aqueous solution.
Figure 4: Effect of adsorbent type on nitrogen removal (adsorbent dosage: 5 g/L, adsorbent size: 63 µm, contact time: 150 min speed: 125 rpm)
As shown in Figure 5, surface of raw adsorbent (Figure 5a) is relatively smooth and flat in contrast to heat-treated adsorbent (Figure 5b) which gives a clear evidence of new porous surface due to the removal of moisture and constituent water in the minerals such as boehmite and gibbsite. Acid-treated adsorbent (Figure 5c) usually leads to formation of additional new cavities along with coarse exterior due to some acid soluble salts. The new generation of new surface areas by acidification was observed from the difference between the SEM images of Figures 5b and 5 c where the pore size of the acid-treated is finer compared to heat-treated adsorbent [21].
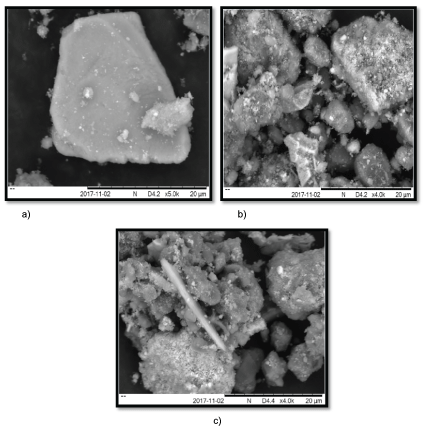
Figure 5: SEM image of: (a) raw adsorbent; (b) heat-treatment adsorbent; (c) acid-treatment adsorbent
The results of SEM confirms that the most effective removal of phosphorus and nitrogen is using acid and heat treated adsorbent red muds than the adsorbent raw red mud.
Factors effecting on the removal of phosphorus and nitrogen by red mud adsorbent was carried out using heat-treated adsorbent since it is cheap and simple compared to acid-treated. Other than that, this method is friendlier to environment because there is no emission of flue gases as well as aqueous solution generation [21]. These factors were red mud particle size, rotational speed, red mud dosage, and time. The optimum condition required to remove maximum nutrient from the wastewater by adsorbents were experimented.
Effect of Adsorbent Size: Figures 6 and 7 show the effect of particle sizes on the percentages of phosphorus and nitrogen removal using heat-treated adsorbent. The sizes used were 63 μm, 125 μm and 180 μm. According to the Figures 6 and 7, the highest percentage of phosphorus and nitrogen removal could be achieved by using size of 63 μm. Adsorbent with size 63 μm has achieved up to 61.86 % and 64.44 % of phosphorus and nitrogen removal respectively after 90 minutes. The particle sizes 125 μm and 180 μm, removed phosphorus and nitrogen 40.68 % and 53.33 %, and 15.18% and 34.04%, respectively. This is because the smaller size of particles could have larger total surface area compared to bigger size of particle [17]. Smaller particles have larger adsorption capacity and show more significant diffusion adsorption due to its larger micro pore volume [22].
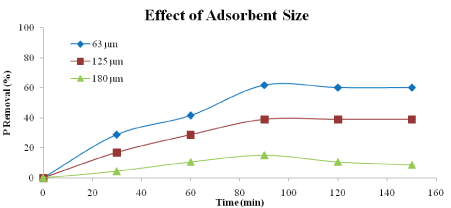
Figure 6: Effect of adsorbent size on phosphorus removal (adsorbent type: heat-treated adsorbent, adsorbent dosage: 5 g/L, speed: 125 rpm, contact time: 150 min)
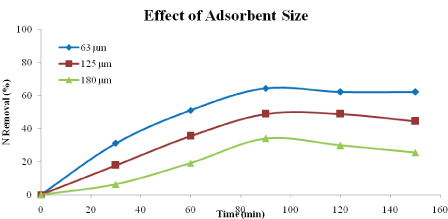
Figure 7: Effect of adsorbent size on nitrogen removal (adsorbent type: heat-treated adsorbent, adsorbent dosage: 5 g/L, speed: 125 rpm, contact time: 150 min)
Effect of rotational speed: Figures 8 and 9 show the effect of rotational speed on percentage of phosphorus and nitrogen removal. The speeds used are 0 rpm (no rotation speed) and 125 rpm. From the graphs, it is clear that application of rotational speed enhanced the phosphorus and nitrogen removal. The optimum removal of phosphorus and nitrogen were 62.71 % and 51.11 %, respectively after 120 minutes of reaction. This is due to disperse of the adsorbent particles in the aqueous solution which lead to reduce the boundary of mass transfer and even it may increase the velocity of the particles, so that increases the percentages of nutrient removal [23].
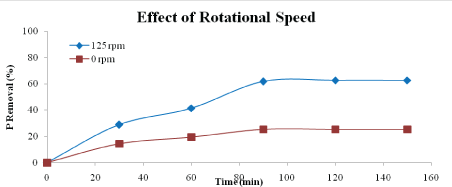
Figure 8: Effect of rotational speed on phosphorus removal (adsorbent type: heat-treatment adsorbent, adsorbent dosage: 5 g/L, adsorbent size: 63 µm, contact time: 150 min)
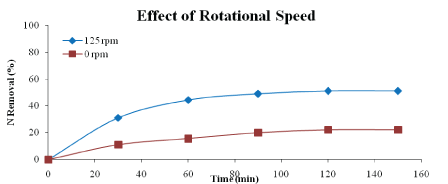
Figure 9: Effect of rotational speed on nitrogen removal (adsorbent type: heat-treated adsorbent, adsorbent dosage: 5 g/L, adsorbent size: 63 µm, contact time: 150 min)
Effect of adsorbent dosage: Figures 10 and 11 show the effect of adsorbent dosage on percentage of phosphorus and nitrogen removal. The dosages used in this study are 1 g/L, 3 g/L and 5 g/L. According to the graph, the highest percentage of phosphorus and nitrogen removal could be achieved by using dosage of 5 g/L which are 45.54% and 59.57%, respectively.
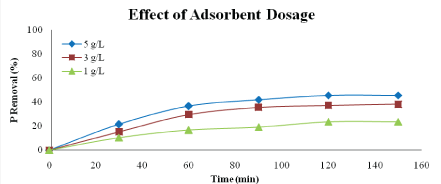
Figure 10: Effect of adsorbent dosage on phosphorus removal (adsorbent type: heat-treated adsorbent, speed: 125 rpm, adsorbent size: 63 µm, contact time: 150 min)
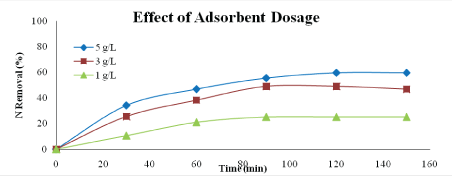
Figure 11: Effect of adsorbent dosage on nitrogen removal (adsorbent type: heat-treated adsorbent, speed: 125 rpm, adsorbent size: 63 µm, contact time: 150 min)
This result is expected because the higher amount of adsorbent the greater the surface area [23]. At higher dosage, the equilibrium uptake of phosphate ions did not increase significantly with increasing adsorbent dosage and due to the saturation level achieved during the adsorption process.
Effect of contact time: Figure 12 shows the effect of contact time on the removal of nutrients from aqueous solutions by heat-treatment adsorbent. The uptake is rapid in the first 60 minutes of contact period. Beyond the 100 minutes of contact time, the amount of nutrients adsorbed on the heat-treatment adsorbent remains constant. The nature of adsorbent and the available adsorption sites affect the rate of adsorption of nutrients. The mechanism of solute transfer to the solid includes diffusion through the fluid film around the adsorbent particle and diffusion through the pores to the internal adsorption sites. In the initial stages of adsorption of nutrients, the concentration gradient between the film and the available pore sites is large, and hence the rate of adsorption is faster. The rate of adsorption decreases in the later stages of the adsorption probably due to the slow pore diffusion of the solute ion into the bulk of the adsorbent [24].
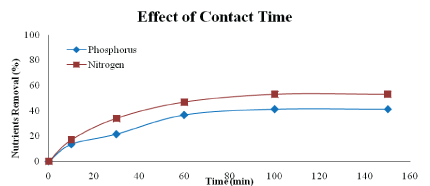
Figure 12: Effect of contact time on nutrients removal (adsorbent type: heat-treated adsorbent, adsorbent dosage: 5 g/L, adsorbent size: 63 µm, contact time: 150 min speed: 125 rpm)
Red mud produced in the process of alumina production is an effective adsorbent for the removal of nitrogen and phosphorus from wastewater. The adsorption process is affected by various factors such as adsorbent treatment, adsorbent size, rotational speed, adsorbent dosage and contact time. The contact time for nitrogen and phosphorus removal is determined as 90 minutes. Taking into consideration of the above results, it can be concluded that the red mud is a suitable adsorbent for the removal of nitrogen and phosphorus from wastewater in term of low-cost due to its availability.
The authors would like to extend their deepest appreciation to University Malaysia Pahang for financial support of this research under RDU 150332 and provide the laboratory facilities and support.
Download Provisional PDF Here
Article Type: RESEARCH ARTICLE
Citation: Mohd Salim NA, Ajit A, Naila A, Ziad Sulaiman A (2018) Potential of Red Mud as an Adsorbent for Nitrogen and Phosphorous Removal in the Petrochemical Industry Wastewater. Int J Water Wastewater Treat 4(1): dx.doi.org/10.16966/2381- 5299.151
Copyright: © 2018 Mohd Salim NA, et al. This is an open-access article distributed under the terms of the Creative Commons Attribution License, which permits unrestricted use, distribution, and reproduction in any medium, provided the original author and source are credited.
Publication history:
All Sci Forschen Journals are Open Access