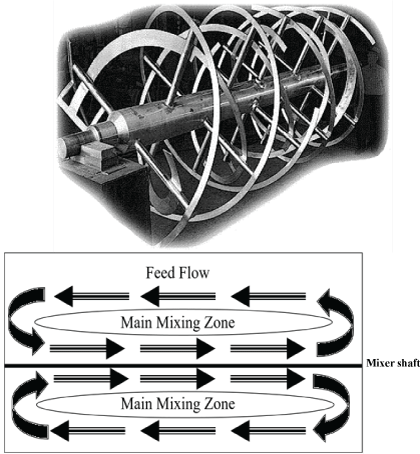
Figure 1: Double Ribbon Mixer-Mixing Zone, side view (modified from Wilcox and Unruh) [7].

M Saensukjaroenphon1 CE Evans1 CK Jones2 CH Fahrenholz3 CB Paulk1 CR Stark1*
1Department of Grain Science and Industry, Kansas State University, Manhattan, KS, USA*Corresponding author: CR Stark, Department of Grain Science and Industry, Kansas State University, Manhattan, KS, USA, E-mail: crstark@ksu.edu
Liquid addition systems are often designed to add liquid ingredients with the shortest application time in order to increase the batching capacity of the mixing process. The quantity of liquid that is added into the mixer affects the batch cycle time, particularly when there is a programmed “wet mix” time or mixing time after liquid application. A shorter application time of liquids typically produces a larger droplet size, which may lead to greater clumping tendencies in the feed and less uniformity of liquid incorporation. Three experiments were conducted to determine the effect of liquid application time and wet mix time on the uniformity of mix with different mixer types. A 230 g/kg NaCl solution was used as a marker to determine mix uniformity. Experiment 1 and 2 treatments were arranged in a 2 × 3 factorial. Experiment 1 treatments were liquid application time (20 and 30s) and wet mix time (15, 30 and 45s) to determine the effect of liquid addition on uniformity of mix using a double ribbon mixer. Experiment 2 treatments were liquid application time (15 and 30s) and wet mix time (10, 20 and 30s) to determine the effect of liquid addition on uniformity of mix using a paddle mixer. Experiment 3 treatments were arranged as a completely randomized design to determine the effect of wet mix time (15, 30 and 45s) on uniformity of mix using a twin shaft counterpoise mixer. There were 3 replicates per treatment and 10 samples per replicate for all experiments. The results of Experiment 1 indicated that wet mix time had a greater effect on percent coefficient of variation (%CV) than application time (P<0.0001 and P=0.6530, respectively) when a 230 g/kg NaCl solution was added to a double ribbon mixer. There was no interaction between application time and wet mix time (P=0.6380). The results of Experiment 2 indicated that both wet mix time and application time affected the %CV (P=0.0009 and P=0.0296, respectively) when a 230 g/kg NaCl solution was added to a paddle mixer. There was no interaction between application time and wet mix time (P=0.2896). The results of Experiment 3 indicated that wet mix time (P=0.5256) did not impact %CV when a 230 g/kg NaCl solution was added to a twin shaft counterpoise mixer. The results of these experiments demonstrated that application time and wet mix time must be determined for each mixer type and size. The data from the experiments suggest that while extended liquid application times are beneficial, there must be a minimum wet mix time after all of the liquids have been added to the mixer.
Liquid addition; Wet mix time; Mixer uniformity
CV-Coefficient of Variation; S-Seconds; SBM-Soy Bean Meal
The number and quantity of liquid ingredients added to the mixer have increased during the last 10 years. Similar to dry ingredient classifications, liquid additives are separated into two groups: macro ingredients that are more than 1 kg/ton and micro ingredients that are less than 1 kg/ton [1]. The total quantity of liquids added to a mixer may affect the batch cycle time, particularly if a constant wet mix time is utilized. The liquid addition times vary based on the quantity of liquid applied and type of application system. Additionally, the droplet size is influenced by pump pressure, number of nozzles, type of nozzle, nozzle position and liquid viscosity [2]. For instance, when the orifice diameter of a nozzle is increased the pressure of the system is decreased when all other application operating parameters are held constant, which produces a larger liquid droplet [3]. The process of mixing dry ingredients with liquid can be described in two steps, starting with coating the dry particles and then allowing the liquid to absorb into the particle. The second step is the dispersing of the particles throughout the mixture [4]. Theoretically, when dry particles come in contact with a large droplet, they have a greater propensity to clump, which may reduce the uniformity of mix. Some clumps can be reduced by the shear force generated by the turning shaft of the mixer. The mixer type and mix time affect the amount of shear force that occurs during the mixing process [5], thereby affecting the size and number of clumps as well as the uniformity of the liquid within the mixture. The uniformity of mix is evaluated by %CV that should be less than 10% which is the percent commonly recognized by the feed industry as the cut-off for uniformity of mix analysis [6]. The different mixer types also have different mixing zone patterns (Figures 1-3) [7, 8] that may affect the proper liquid mix time. Froetschner [9] recommended both dry and wet mix times by mixer type. However, there is limited data to support those suggested wet mix time. The objectives of these experiments were to determine the effect of liquid application time and wet mix time on the uniformity of mix in three different types of mixers.
Figure 1: Double Ribbon Mixer-Mixing Zone, side view (modified from Wilcox and Unruh) [7].
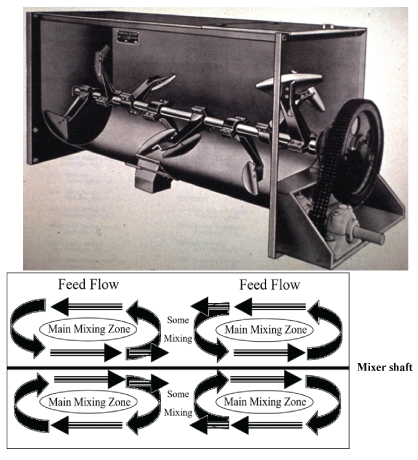
Figure 2: Paddle Mixer-Mixing Zone, side view (modified from Wilcox and Unruh) [7].
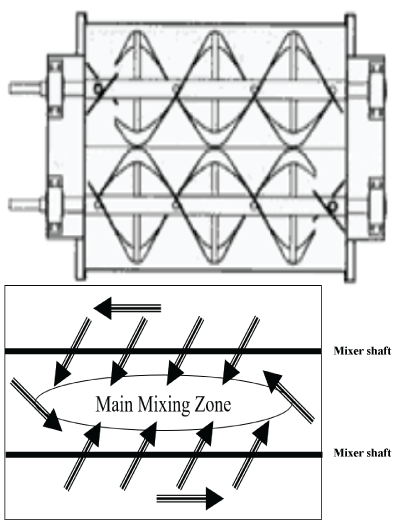
Figure 3: Twin shaft counterpoise mixer-Mixing Zones, top view (modified from Presnell) [8].
Treatments were arranged in a 2 × 3 factorial of liquid application time (20 and 30s) and wet mix time (15, 30 and 45s) to determine the effect of liquid addition on uniformity of mix. A corn-soybean meal swine grower diet (27.2 kg) was used for the experiment. A 230 g/ kg NaCl solution was prepared by mixing 230 g of salt with 770 g of distilled water. The dry ingredients were added to a 0.056 m3 double ribbon mixer (Model HP2SSS-0106, Hayes and Stolz, Fort Worth, TX). The feed ingredients were mixed for 15s followed by the addition of 0.62 kg (544 mL) of a 230 g/kg NaCl solution to the dry feed in the mixer by using a hand-held sprayer (Model 26329, Orscheln Farm & Home LLC, Moberly, MO) with 2 different application times by using different nozzles (Models TP11015 and TP11006, Teejet Technologies, Springfield, IL). A 30 g sample was scooped out from the mixture surface at ten points in the mixer (Figure 4) after the feed was mixed for 15, 30 and 45s wet mix times. Diets were mixed 3 separate times to provide 3 replicates per treatment. Samples were analyzed for salt concentration.
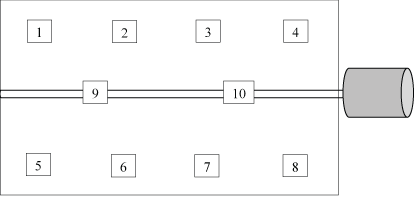
Figure 4: The sampling points of the mixer surface (top view).
The salt concentration in the collected samples was determined with the Quantab® chloride titrator method [10]. A 10 g sample was weighed into a cup and 90 g of hot distilled water (60°C) was added to the cup. The mixture was stirred for 30s, allowed to rest for 60s, and stirred for another 30s. A folded filter paper was placed into the cup and the Quantab® strip was inserted into the liquid at the bottom of the filter paper. The coefficient of variation (CV) was calculated by dividing the standard deviation by the average of 10 samples and then multiplying by 100 for each batch of feed.
Treatments were arranged in a 2 × 3 factorial of liquid application time (15 and 30s) and wet mix time (10, 20 and 30s) to determine the effect of liquid addition on uniformity of mix. Corn (90.40 kg) was added to a 0.170 m3 paddle mixer (Model 2014197-SS-S1, Davis, Bonner Springs, KS). A 230 g/kg NaCl solution was prepared by mixing 345 g of salt with 1,155 g of distilled water. The corn was mixed for 15s followed by the addition of 1.03 kg (1813 mL) of a 230 g/kg NaCl solution to the corn in the mixer with two different application times (15 and 30s) by using 2 or 4 hand-held sprayers (Model 26329, Orscheln Farm & Home LLC, Moberly, MO) with a nozzle (Model TP11020, Teejet Technologies, Springfield, IL), respectively. A 30 g sample was scooped out from the mixture surface at ten points in the mixer (Figure 4) after the mixture was mixed for 10, 20 and 30s wet mix times. Diets were mixed 3 separate times to provide 3 replicates per treatment. Samples were analyzed for salt concentration with Quantab® strips as previously described in Experiment 1.
Treatments were arranged as a completely randomized design to determine the effect of wet mix time (15, 30 and 45s) on uniformity of mix using a twin shaft counterpoise mixer. Corn (820.10 kg) was added to a 1.64 m3 twin shaft counterpoise mixer (Model TRDB63- 0512, Hayes and Stolz, Fort Worth, TX). A 230 g/kg NaCl solution was prepared by mixing 4.6 kg of salt with 15.4 kg of distilled water. The corn was mixed for 15s followed by the addition of 19.05 kg (16.77 L) of a 230 g/kg NaCl solution to the corn in the mixer by using a liquid pump (Model 2AP21, Roper Pump Co., Commerce, GA) with three nozzles. Ten samples were taken from a sampling port located in the transition between the mixer conveyor and bucket elevator leg every 20 seconds after the mixture was mixed for 15, 30 and 45s wet mix times. Diets were mixed 3 separate times to provide 3 replicates per treatment. Samples were analyzed for salt concentration with Quantab® strips as previously described in Experiment 1.
Data were analyzed as a factorial treatment design for the first two experiments and as a completely randomized design for the last experiment. Experiment 1 treatments were arranged in a 2 × 3 factorial of liquid application time (20 and 30s) and wet mix time (15, 30 and 45s) to determine the effect of liquid addition on uniformity of mix using a double ribbon mixer. Experiment 2 treatments were arranged in a 2 × 3 factorial of liquid application time (15 and 30s) and wet mix time (10, 20 and 30s) to determine the effect of liquid addition on uniformity of mix using a paddle mixer. Experiment 3 determined the effect of wet mix time (15, 30 and 45s) on uniformity of mix using a twin shaft counterpoise mixer. There were 3 replicates per treatment. Data were analyzed using the GLIMMIX procedure of SAS (SAS Institute, Inc., Cary, NC). Means were separated using least squares means adjustment for Bonferroni’s multiple comparisons. Linear and quadratic polynomial effects were analyzed when significant differences between treatment means occurred. Results were considered significant at P ≤ 0.05.
For Experiment 1 (Table 1), there was no interaction between application time and wet mix time (P=0.6380). The average actual application time for 20 and 30s were 19.0 and 30.9s, respectively. The %CV for the 20s and 30s application times was not different (P=0.6530; 22.66 and 21.76%, respectively). However, there was a quadratic decrease in %CV as the wet mix time increased (P=0.0241). The lowest %CV occurred after the feed was mixed for a 45s wet mix time. The wet mix time had a greater effect on %CV than application time for a 0.056 m3 double ribbon mixer.
| Application times, s | Wet mix times, s | n | Coefficient of variation (CV)[a],% |
| Interaction effects | |||
| 20 | 15 | 3 | 37.87 |
| 20 | 30 | 3 | 20.12 |
| 20 | 45 | 3 | 9.99 |
| 30 | 15 | 3 | 36.55 |
| 30 | 30 | 3 | 17.13 |
| 30 | 45 | 3 | 11.59 |
| SEM | 2.41 | ||
| Main effect | |||
| 20 | 9 | 22.66 | |
| 30 | 9 | 21.76 | |
| SEM | 1.39 | ||
| 15 | 6 | 37.21A | |
| 30 | 6 | 18.63B | |
| 45 | 6 | 10.79C | |
| SEM | 1.7 | ||
| P-value | |||
| Source of variation | |||
| Application time × Wet mix time | 0.6380 | ||
| Application time | 0.6530 | ||
| Wet mix time | <0.0001 | ||
| Linear | <0.0001 | ||
| Quadratic | 0.0241 | ||
| [a]Means within a main effect of wet mix times followed by different letters (A to C) are significantly different (P ≤ 0.01). | |||
Table 1: Effect of liquid application time and wet mix time on the percent coefficient of variation (CV) of mixture and sprayed with a 230 g/kg NaCl solution in a double ribbon mixer (Exp. 1).
For Experiment 2 (Table 2), there was no interaction between application time and wet mix time (P=0.2896). Both wet mix time and application time affected the %CV when a 230 g/kg NaCl solution was added to a 0.170 m3 paddle mixer. The average actual application time for 15 and 30s were 13.0 and 27.3s, respectively. The 15s application time resulted in an increased %CV compare to the 30s application time (P=0.0296). As the wet mix time was increased from 10 to 30s, the %CV decreased from 17.0 to 8.23%, respectively (linear; P=0.0004).
| Application times, s | Wet mix times, s | n | Coefficient of variation (CV)[a], % |
| Interaction effects | |||
| 15 | 10 | 3 | 20.23 |
| 15 | 20 | 3 | 11.83 |
| 15 | 30 | 3 | 8.46 |
| 30 | 10 | 3 | 13.76 |
| 30 | 20 | 3 | 7.79 |
| 30 | 30 | 3 | 7.99 |
| SEM | 1.82 | ||
| Main effect | |||
| 15 | 9 | 13.51a | |
| 30 | 9 | 9.84b | |
| SEM | 1.05 | ||
| 10 | 6 | 17.00X | |
| 20 | 6 | 9.81Y | |
| 30 | 6 | 8.23Z | |
| SEM | 1.29 | ||
| P-value | |||
| Source of variation | |||
| Application time × Wet mix time | 0.2896 | ||
| Application time | 0.0296 | ||
| Wet mix time | 0.0009 | ||
| Linear | 0.0004 | ||
| Quadratic | 0.1004 | ||
| [a]Means within a main effect of application time followed by different letters (a, b) are significantly different (P ≤ 0.05), and means within a main effect of wet mix time followed by different letters (X to Z) are significantly different (P ≤ 0.01). | |||
Table 2: Effect of liquid application time and wet mix time on the percent coefficient of variation (CV) of mixture and sprayed with a 230 g/kg NaCl solution in a paddle mixer (Exp. 2).
For Experiment 3 (Table 3), the target inclusion of the 230 g/kg NaCl solution was 19.05 kg; however, the average actual amount was 18.86 kg. The NaCl solution application time was 41.6s. The results indicated that increasing wet mix time did not affect the %CV when a 230 g/kg NaCl solution was added to a 1.64 m3 twin shaft counterpoise mixer (P=0.5256). There was no improvement in %CV as the wet mix time increased due to the combination of the long liquid addition time and the 15s and longer designated wet mix times exceeding the optimal liquid mix time for achieving a complete mix.
| Wet mix time (s) | n | Coefficient of variation, CV (%) |
| 15 | 2 | 5.84 |
| 30 | 3 | 4.49 |
| 45 | 3 | 4.86 |
| SEM | ||
| P-value | ||
| Source of variation | ||
| Wet mix time | 0.5256 | |
Table 3: Effect of wet mix time on the percent coefficient of variation (CV) of mixture and sprayed with a 230 g/kg NaCl solution in a twin shaft counterpoise mixer (Exp. 3).
The results of these experiments indicated the importance of testing mixers at the time of installation as required for the CGMPs [FDA, [11], 21 CFR part 225.30 (a)]. The %CV of mixture with a ribbon mixer did not change when the liquid application time was decreased while the %CV of the mixture with a paddle mixer increased when decreasing the liquid application time. The %CV of mixture with a twin shaft counterpoise mixer did not change when the wet mix time was increased whereas the %CV of the mixtures with a paddle mixer and double ribbon decreased when increasing the wet mix time. The different responses on %CV of three mixer types and sizes when increasing mix time or decreasing liquid application time may be caused by the differences of shear force level and mixing zone. The results of the experiments also demonstrated that dry mix, liquid addition time and wet mix time cannot be generically applied to mixers based on size and type.
These results demonstrated that liquid application time and wet mix time must be determined for each mixer’s type and size. In addition, while extended liquid application times may be beneficial, there must be a minimum wet mix time after all of the liquids have been added to the mixer.
Download Provisional PDF Here
Article Type: RESEARCH ARTICLE
Citation: Saensukjaroenphon M, Evans CE, Jones CK, Fahrenholz CH, Paulk CB, et al. (2019) The Effect of Liquid Application Time and Wet Mix Time with Different Mixer Types on Uniformity of Mix. J Anim Sci Res 3(2): doi doi dx.doi.org/10.16966/2576-6457.126
Copyright: © 2019 Saensukjaroenphon M, et al. This is an open-access article distributed under the terms of the Creative Commons Attribution License, which permits unrestricted use, distribution, and reproduction in any medium, provided the original author and source are credited.
Publication history:
All Sci Forschen Journals are Open Access