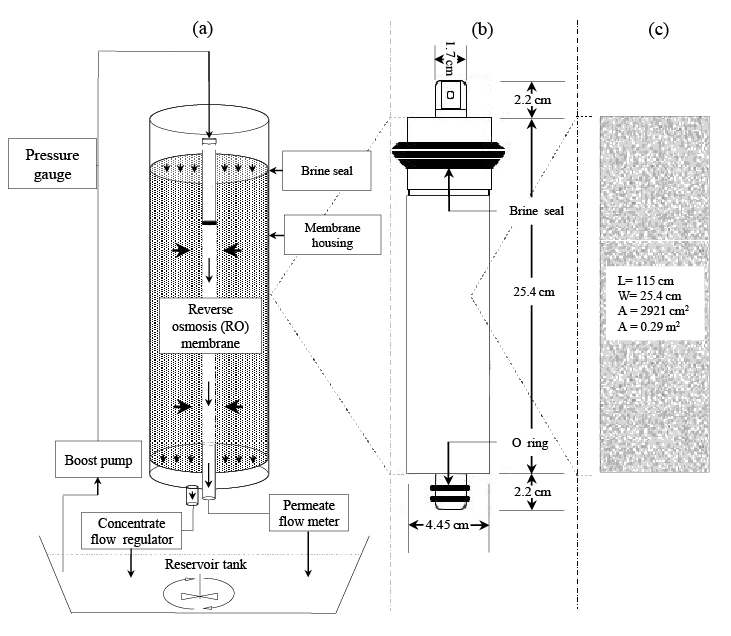
Figure 1: (a) Experimental setup with reversed permeate and concentrate flow, (b) Configuration of the spiral wound TW30-1812-36 RO membrane element and, (c) Effective surface area of the membrane with dimensions.

A.K.M. Ashadullah*1 Naoyuki Kishimoto2
1Graduate School of Science and Technology, Department of Environmental Solution Technology, Ryukoku University, 1-5 Yokotani, Seta Oe-cho, Otsu-shi, Shiga 520-2194, Japan*Corresponding author: A.K.M. Ashadullah, Graduate School of Science and Technology, Department of Environmental Solution Technology, Ryukoku University, 1-5 Yokotani, Seta Oecho, Otsu-shi, Shiga 520-2194, Japan, E-mail: akmashadullah@gmail.com
In recent times, the practice of reverse osmosis (RO) membrane technology has become a feasible alternative tool for the wastewater reclamation and reuse. In this research we investigated the applicability of a commercial polyamide RO element to the treatment of municipal sewage-based synthetic wastewater contaminated with nitrite, nitrate, iron, and manganese. The results showed that the RO element achieved the complete removal of BOD, COD, and total coliform. Besides, the ions rejection rates were 98% for iron, 97% for manganese, 93% for chloride, 80% for nitrite, 77% for nitrate, and 45% for ammonia, respectively. Although, dissolved matters in feed water did not cause any significant fouling, organic aggregates and inorganic particles like iron (Fe) colloids decreased the permeate flux of the membrane. The permeate flux of membranes fouled by organic aggregates was successfully recovered to 79% of the initial flux by backwashing from the concentrate port with sodium hydroxide (NaOH) solution at the concentration of 1,000 mg-NaOH/L. The efficiency of NaOH in permeate flux recovery was inferred to be owing to hydrolyzation and solubilization of organic matter by NaOH. On the contrary, the permeate flux fouled by Fe colloids was completely recovered, when backwashing with the deionized water was applied just after the fouling, which suggested that the membrane fouling by Fe colloids was mainly caused by the physical clogging in the membrane.
Reverse osmosis; Wastewater reclamation; Nitrite; Nitrate; Iron; Manganese; BOD; COD
Globally, the water demand is increasing more rapidly than the population growth. As a result, water reuse and recycling approaches under the sustainable development concept have become indispensable for the future generations [1]. Although, conventional treatment processes like activated sludge processes have been widely used for the water treatment, in most of the cases these processes are inefficient in removing part of hydrophilic organic compounds such as disinfection by-products and pharmaceutical compounds [2]. In these cases, reverse osmosis (RO) system can be used as a potential candidate, which can remove various solutes through charge repulsion and size exclusion mechanism. It is noticeable that an emerging application of RO membranes in the area of wastewater treatment has rapidly grown over the past 40 years [3]. The RO has been employed extensively in the treatment of radioactive wastewater, municipal wastewater, contaminated groundwater, and wastewaters from electroplating, metal finishing, pulp and paper, mining, petrochemical, textile, and food processing industries [4]. In addition, RO systems are being used in combination with other treatment processes such as oxidation, adsorption, stripping, or biological treatment to produce high quality product water that can be reused or discharged [5]. The RO technology is becoming more popular in the home market, because citizens are increasingly concerned about hazardous contaminants as well as non-hazardous chemicals that affect the taste, odor, or color of their drinking water [6]. The groundwater quality in many developing countries like Bangladesh exceeds the drinking water quality standards. Accordingly, different types of traditional water treatment technologies are applied but, due to higher pollution and technological inefficiency the drinkable water crisis is increasing more rapidly than the population growth [7]. The application of RO technology could be an alternative solution. However, in membrane technologies membrane fouling is the most significant factor that limiting their applications to the water and wastewater treatment. The deposition of unwanted materials on the membrane surface results in increasing filtration downtime and higher energy requirements for membrane operation [8]. The aim of this research work was to investigate the removal efficiency of physical, chemical, and biological indices of wastewater containing nitrite (NO2 - ), nitrate (NO3 - ), iron (Fe2+), and manganese (Mn2+), which are a model of contaminated groundwater in Bangladesh, where NO2 - , NO3 - , Fe2+, and Mn2+ are detected in ground water at the concentrations of 10, 20, 10, and 2 mg/L, respectively [9-11]. The main causes of fouling and an effective method for successive permeate flux recovery (PFR) technique were also discussed.
Figure 1a shows the laboratory scale experimental setup, which was composed of a pressure boost pump (CDP6800, Aquatec, USA), a pressure gauge (PG-35, Copal Electronics, Japan), a spiral wound polyamide thin-film composite type RO membrane (TW30-1812-36, Dow Filmtec, USA), a water regulator (R91W-2AK-NLN, Norgren, UK), a flow meter (RK400, Kofloc, Japan), a mixer (SMT-102, AS ONE, Osaka, Japan) and a 50 liter capacity plastic bucket used as a reservoir tank. Figure 1b shows the configuration of the RO membrane element. A rubber type brine seal and two O-rings were fitted in the feed and product port portion respectively, to prevent leakages while in operation. Figure 1c shows the membrane size installed in the membrane unit. The membrane had 25.4 cm in width and 115 cm in length, which resulted in total surface area of 0.29 m2 .
Table 1 shows a list of chemicals used to prepare the synthetic wastewater (SW), test solution for salt rejection rate (SRR) measurement, and backwashing solution for a fouled membrane (FM). These chemicals for SW were spiked into the 5-times diluted municipal wastewater in Ryukoku University at the final concentration shown in Table 1, though the chemicals for test solution and the backwashing solution were spiked into deionized water (DW). Table 2 shows the SW characteristic for Run 1. Table 3 shows the SW characteristics and operational conditions for Run 2, 3, and 4. Table 4 shows the actual wastewater (AW) characteristics for Run 5, 6, and 7. Table 5 shows the SW characteristics for Run 8, 9, and 10. The total coliform (TC) in Table 2 (Run 1) and Table 3 (Run 2, 3, and 4) was in the SW that contained 5-times diluted municipal wastewater, and TC in Table 4 (Run 5, 6, and 7) was in the AW that was not diluted. As a result, the measured TC in Tables 2 and 3 was lower than that in Table 4.
The Run 1 was conducted to observe the relation between permeate flux (PF) and transmembrane pressure (TMP) along with permeate water quality. Runs 2, 3, and 4 were conducted to observe the effect of suspended solid (SS), iron (Fe) colloids, and dissolved matters (DM) on membrane fouling, respectively. Runs 5, 6, and 7 were conducted to observe the effect of backwashing on PFR of a FM mainly fouled by organic aggregates and Runs 8, 9, and 10 were conducted to observe the effect of backwashing on PFR of a FM mainly fouled by iron (Fe) colloids. Before each experimental run the new RO membrane was inserted into the membrane housing. Then the permeate port (PP) and concentrate port (CP) was connected properly. After that, the new membrane was washed using the DW for 30 minutes and then used for the experiments. In the case of Run 1, 5, 6, and 7 the permeate water (PW) was discharged but concentrate water (CW) was returned into the reservoir tank. However, in the case of Run 2, 3, 4, 8, 9, and 10 both the PW and CW were returned into the reservoir tank as shown in Figure 1a. While running the experiments the mixer was continuously operated at 250 rpm to mix the feed water uniformly. The Runs 1-10 were operated at the TMP of 390 ± 49 kPa, though the TMP at Run 1 was ranged from 354 to 480 kPa. After the experimental run was finished, the PFR experiment was conducted using the same configuration of Figure 1a but opposing the flow direction. Here, DW, sodium lauryl sulfate (SLS), sodium hydroxide (NaOH) and citric acid monohydrate (CAM) (C6 H8 O7 .H2 O) solutions were used as feed water which were flowed into the CP but blocking the PP for the backwashing of a FM at the flow rate of 1175 ± 50 mL/min and at the TMP of 17.50 ± 2.89 kPa. All the runs were performed under air-conditioned room temperature at 25°C. For sampling and analysis the effluent was collected from the PP using laboratory grade plastic bottles.

Figure 1: (a) Experimental setup with reversed permeate and concentrate flow, (b) Configuration of the spiral wound TW30-1812-36 RO membrane element and, (c) Effective surface area of the membrane with dimensions.

Table 1: List of chemicals used in the experiment.

Table 2: Synthetic wastewater characteristics of Run 1.
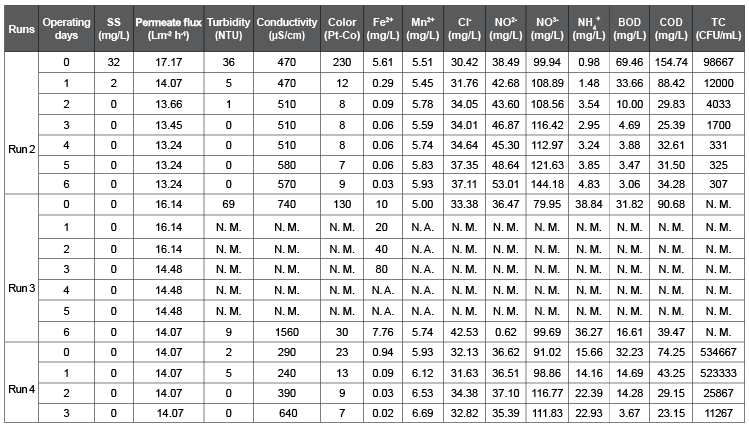
Table 3: Synthetic wastewater characteristics and operational conditions of Run 2, 3, and 4.
N. M: Not Measured, N. A: Not Added.
⃰ The spiked Fe concentration.

Table 4: Actual wastewater characteristics of Run 5, 6, and 7. N. D: Not Detected.

Table 5: Synthetic wastewater characteristics of Run 8, 9, and 10.
N. D: Not Detected, N. M: Not Measured.
The spiked Fe concentration=150 mg/L.
All the analyses were done according to the standard methods [12]. The pH, dissolved oxygen (DO), and electrical conductivity (EC) were measured with a pH meter (B- 212, Horiba, Japan), a DO meter (LDO, HQ10, Hach, USA), and an electrical conductivity meter (Twin cond, B-173, Horiba, Japan). The turbidity and color were measured with a digital turbidity/color meter (Aqua Doctor, WA-PT-4DG, Kyoritsu Chemical-Check Lab, Japan). The concentrations of Cl- , NO2 - , and NO3 - were determined by the ion chromatography (PIA-1000, Shimadzu, Japan) and NH4 + was determined by the indophenol method. The Fe2+ was measured by phenanthroline method and Mn2+ was measured by the inductively coupled plasma spectrometry (ICP, Optima 5300DV, PerkinElmer, USA). Total coliform (TC) was measured by the colony count, most probable number (MPN) method. The biochemical oxygen demand (BOD) was measured by BOD in five days (BOD5 ) method and chemical oxygen demand (COD) was measured by dichromate (CODCr) method. DW of EC less than 1 μS/cm was used for the dilution and preparation of standard solution, as obtained from a water purification system (Autostill, WA5000, Yamato, Japan).
The permeate water quality of the RO membrane was examined using the SW shown in Table 2 (Run 1). In this experimental study, the RO system was operated periodically in three phases using a membrane. In the first phase, it was operated for four hours at an initial permeate flux (IPF) of 6.21 L m-2 h-1 and transmembrane pressure (TMP) of 354 kPa (Figure 2a). The flux was calculated using the equation 1:
$$Flux\,\,(L{m^{ - 2}}{h^{ - 1}})\, = \,{{\rm{Q}} \over A}...............1$$
Where Q is the filtration flow rate (L/h) and A is the effective surface area of the membrane (m2 ). The influent SS was 100 mg/L. In the second phase, it was operated for an hour at IPF of 9.31 L m-2 h-1 and TMP of 407 kPa (Figure 2b). The influent SS was 16 mg/L. In the third phase, it was also operated for an hour at IPF of 12.41 L m-2 h-1 and TMP of 480 kPa (Figure 2c). The influent SS was 42 mg/L. Although, the SW in all of three phases had the different SS concentrations, but the changes in TMP and PF over time were not observed. A TMP increase and a PF decrease are usually observed during the membrane process. But, in this experiment both the TMP and PF was found almost constant at initial and ending stage. Relatively short operational time of the experiments may cause this result. Figure 2d shows the relationship between the TMP and PF. The TMP was linearly increased with the increasing of PF at the R2 value of 0.99. Vrijenhoek et al. [13] reported the similar result like the linear relationship between the TMP and PF in the RO filtration system without fouling, which accords with our present experimental study. Figure 2e shows the effluent water characteristics of Run 1. The SS, TC, BOD, and COD were removed completely (100%) and the removal efficiency of turbidity and color was found to be 99%, but conductivity removal efficiency was found to be 84%. As the result of low removal efficiencies of NO2 - and NO3 - (Figure 2e) and relatively high concentration of NO2 - and NO3 - in the SW (Table 2), the conductivity removal efficiency was lower than the salt rejection rate in the RO membrane specification, which was measured using sodium chloride (NaCl) solution. Moreover, the cations of Fe2+ and Mn2+ and the anions of chloride (Cl- ), NO2 - , and NO3 - were removed at the rate of 98%, 97%, 93%, 80%, and 77%, respectively. Chianese et al. [14], Fakhru’l-Razi et al. [15] and Comerton et al. [16] also experienced the similar removal phenomenon of these indices in their RO filtration systems. However, the ammonia (NH3 ) removal efficiency was found to be less than other indices and it was calculated to be 45%. The less NH3 removal efficiency can be explained by the less molecular weight than that of other solutes, which leads lower rejection rate by the RO. Funston et al. [17] also explained the allied experimental results in their study.
In the following experimental study, the RO system was operated using 20 L of SW as influent (Table 3). The operational period was 7 days for Run 2 and 3 and 4 days for Run 4. Figure 3a shows the effect of SS on membrane fouling in Run 2. Here, the experiment was started at the IPF of 17.17 L m-2 h-1, TMP of 450 kPa and initial SS of SW was 32 mg/L, which was mainly composed of organic aggregates from the municipal wastewater. After 2 days operation the SS of the influent was found 0 mg/L and PF decreased to 13.66 L m-2 h-1. The PF gradually decreased up to 4 days, and then it reached a constant at 13.24 L m-2 h-1. Since, both permeate and concentrate were returned to the reservoir tank in this experiment, the decrease in SS showed the accumulation of SS in the membrane unit.
In the case of Run 3, SS in the SW was completely removed using a glass fiber filter with 1 µm particle rejection (GF/B, Whatman, Japan). Then, NO2 - , NO3 - , Fe2+, and Mn2+ ions were spiked into the filtrated SW (Table 3). Figure 3b shows the behavior of Fe colloids on membrane fouling. Here, the experiment was started at the IPF of 16.14 L m-2 h-1 and TMP of 358 kPa. At the operation time 0, 1, 2, and 3 days Fe2+ was spiked into the SW at the final concentration of 10, 20, 40, and 80 mg/L, respectively, but PF remained constant as initial (16.14 L m-2 h-1) up to 2 days operation. When, Fe2+ was spiked into the SW at the final concentration of 80 mg/L at 3 days operation, the PF decreased to 14.48 L m-2 h-1. Then, the run was continued in operation up to 6 days without addition of Fe2+. The PF was remained constant at 14.48 L m-2 h-1 from 3 to 5 days operation, but it slightly dropped to 14.07 L m-2 h-1 at the operation time of 6 days. Since, both permeate and concentrate were also returned to the reservoir tank, the drop in the Fe concentration indicates the accumulation of Fe colloids in the membrane unit as similar to SS accumulation in Run 2.
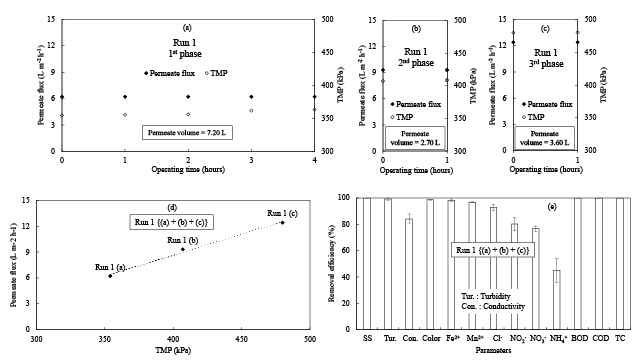
Figure 2: Experimental results of RO treatments under different TMP (Run 1). (a), (b) and (c) PF and TMP changes over time, (d) Relationship between TMP and PF, and (e) Removal efficiency of each index from Run 1 (a), (b) and (c). The error bars depict the unbiased standard deviation.
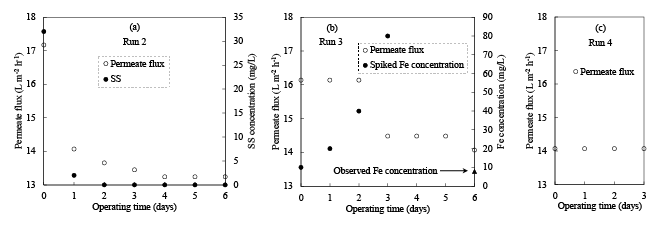
Figure 3: (a) Experimental results of RO treatments using normal SW (Run 2), (b) SW with NO2 - ,NO3 - , Fe2+, and Mn2+ addition after SS removal (Run 3), and (c) SW with NO2 - , NO3 - , Fe2+, and Mn2+ addition before SS removal (Run 4).
In the case of Run 4, SS was completely removed using a glass fiber filter with 1 µm particle rejection (GF/B, Whatman, Japan) after NO2 - , NO3 - , Fe2+, and Mn2+ ions were spiked into the SW. As a result, the initial Fe2+ concentration in SW of Run 4 was 0.94 mg/L (Table 3). This indicates that spiked Fe2+ was rapidly transformed into Fe colloids according to the equations 2 and 3 in the SW and most of the Fe was removed by the microfiltration.
$${\rm{4Fe}}_{}^{2 + } + {O_2} + 4H_{}^ + \to 4Fe_{}^{3 + } + 2{H_2}O......................2$$
$${\rm{Fe}}_{}^{3 + } + 3OH_{}^ - \to Fe{(OH)_3} \downarrow ......................3$$
Figure 3c shows the influence of dissolved matters (DM) on membrane fouling. Here, the experiment was started at the IPF of 14.07 L m-2 h-1 and TMP of 459 kPa with the feed water EC=640 µS/cm. The PF remained constant at the initial value (14.07 L m-2 h-1) during the consecutive 4 days operational period. This result strongly supports that DM did not take part in membrane fouling.
As a result of Run 2-4, the main foulants were proved to be SS mainly composed of organic aggregates and Fe colloids. To recover the PF of the FM, the PFR experiments were demonstrated on Run 5, 6, 7, 8, 9, and 10, where, Run 5, 6, and 7 were fouled by organic aggregates and Run 8, 9, and 10 were fouled by Fe colloids. The equation 4 was used to calculate the PFR rate of a FM:
$$P{F_{rate}}\,(\% )\, = \,{{{\rm{Permeate}}\,{\rm{flux}}\,{\rm{after}}\,{\rm{cleaning}}\,{\rm{at}}\,{\rm{ DW}}} \over {Initial\,{\mathop{\rm Permeate}\nolimits} \,flux\,at\,DW}} \times \,100...............4$$
The membranes of Runs 5, 6, and 7 were fouled using AW shown in Table 4 and the membranes of Run 8, 9 and 10 were fouled using SW shown in Table 5. After every step of PFR experiment the salt ejection rate (SRR) was checked by using the NaCl solution (pH 6.2) at the NaCl concentration of 2000 mg/L with the equivalent electrical conductivity (EC) of 3300 µS/cm (Table 1). The SRR was calculated as a percentage from the equation 5:
$$SRR\,(\% )\, = \,{{Feed\,water\,EC - \,{\mathop{\rm Permeate}\nolimits} \,water\,EC} \over {Feed\,water\,EC}} \times \,100...............5$$
Figure 4a shows the PF recovery phenomenon of Run 5 by backwashing with DW (pH 7.1).253 The IPF of the membrane was recorded to be 19.03 L m-2 h-1 with respect to DW. Then, it was used for fouling experiment using the AW with the SS concentration of 300 mg/L and TMP of 320 kPa (Table 4). After 16 hours operation the membrane was fouled and final permeate flux (FPF) was observed 2.07 L m-2 h-1 with respect to DW. Then, the FM was used for the PFR experiment. Here in the 1st step the FM was backwashed with DW for 30 minutes. As a result, the PF was recovered to 5.38 L m-2 h-1 that was equivalent to the PFR rate of 28.3%. Next, in the 2nd step it was again backwashed with DW for 2 hours at the same condition. Then, the PF was further improved to be 6.62 L m-2 h-1 that was equivalent to the PFR rate of 34.8%. The subsequent backwashing with DW in the 3rd step for 2 hours the PF further slightly improved to 7.03 L m-2 h-1 that was equivalent to the PFR rate of 37.0%. However, additional backwashing with DW in the 4th step for 2 hours were not effective in PFR. The final SRR was found 92.7%.
Figure 4b shows the PF recovery phenomenon of Run 6 by backwashing with DW and sodium lauryl sulfate (SLS) solution (pH 6.2). The IPF of the membrane was recorded to be 14.07 L m-2 h-1 with respect to DW. After that, it was used for fouling experiment using the AW with the SS concentration of 136 mg/L and TMP of 370 kPa (Table 4). After 18 hours operation the membrane was fouled and the PF dropped to 5.79 L m-2 h-1. Then, the FM was used for the PFR experiment. Here, in the 1st step the FM was backwashed with DW for 30 minutes. As a result, the PF increased to 6.62 L m-2 h-1 that was equivalent to the PFR rate of 47.1%. In the 2nd step it was again backwashed with DW for 30 minutes at the same condition. Then, the PF was further improved to be 7.86 L m-2 h-1 that was equivalent to the PFR rate of 55.9%. However, when it was backwashed with the SLS solution at the concentration of 1000 mg/L in the 3rd step for 5 minutes and 4th step for 20 minutes sequentially, the PF decreased to 7.03 and 4.55 L m-2 h-1, respectively. Therefore, SLS solution was thought to be an ineffective chemical in PFR of a FM, though it is a useful coating material for anti-fouling [18].
After that, this FM was backwashed with the NaOH solution (pH 12.4) at the concentration of 1000 mg/L for 30 minutes and PF recovered to 8.28 L m-2 h-1 and SRR was found to be 97.6%. Then, this recovered membrane was applied for the second time in the Run 7. Figure 4c shows the PF recovery phenomenon of Run 7 by backwashing with DW and NaOH solution. The IPF of this membrane was considered to be the same as Run 6 namely 14.07 L m-2 h-1 with respect to DW. After that, it was used for the fouling experiment using the AW with the SS concentration of 46 mg/L and TMP of 390 kPa (Table 4). After 16 hours operation the membrane was fouled and the PF decreased to 5.17 L m-2 h-1 with respect to DW. Then, the FM was used for the PFR experiment. Here, in the 1st step the FM was backwashed with DW for 30 minutes. As a result, the PF was observed to be 6.21 L m-2 h-1 that was equivalent to the PFR rate of 44.1%. In the 2nd step it was backwashed with the NaOH solution with the concentration of 1000 mg/L for 2 hours and the PF resulted in 10.34 L m-2 h-1 that equivalent to the PFR rate of 73.5%. The subsequent backwashing with the NaOH solution in the 3rd step for 2 hours further improved the PF to 11.17 L m-2 h-1 that was equivalent to the PFR rate of 79.4%. However, additional backwashing with the NaOH solution at the 4th steps for 2 hours were not effective in PFR and the final SRR was found 98.0%.
Figure 4d shows the PF recovery phenomenon of Run 8 by backwashing with DW just after fouling. The IPF of the membrane was recorded 17.38 L m-2 h-1 with respect to DW. Then, it was used for fouling experiment using the SW with the Fe2+ concentration of 144 mg/L and TMP of 326 kPa (Table 5). After 16 hours operation the membrane was fouled and the PF was observed to be 15.52 L m-2 h-1 with respect to DW. Then, the FM was used for the PFR experiment. In the 1st step it was backwashed with DW for 30 minutes and the PF was measured to be 16.14 L m-2 h-1 that was equivalent to the PFR rate of 92.8%. Next, in the 2nd step it was again backwashed with DW for 30 minutes and PF recovered to 17.38 L m-2 h-1 that was equivalent to the PFR rate of 100% and last of all SRR was found to be 93.0%.
Figure 4e shows the PF recovery phenomenon of Run 9 by backwashing with NaOH solution. The IPF of the membrane was recorded 22.76 L m-2 h-1 with respect to DW. Then, it was used for the fouling experiment using the SW with the Fe2+ concentration of 125 mg/L and TMP of 400 kPa (Table 5). After 16 hours operation the filtration was stopped and membrane was kept on the experimental setup for 7 days to mature the fouling by Fe colloids. After the maturation the PF was observed to be 16.55 L m-2 h-1 with respect to DW. Then, the FM was used for PFR experiment. In the 1st step it was backwashed with the NaOH solution for 30 minutes and the PF was measured to be 20.28 L m-2 h-1 that was equivalent to the PFR rate of 89.1%. Next, in the 2nd step additional backwashing with NaOH for 30 minutes were not effective in PFR. The final SRR was found to be 87.6%.
Figure 4f shows the PF recovery phenomenon of Run 10 by backwashing with CAM (pH 1.5). The IPF of the membrane was recorded to be 18.62 L m-2 h-1 with respect to DW. Then, it was used for the fouling experiment using the SW with the Fe2+ concentration of 129 mg/L and TMP of 372 kPa (Table 5). After 21 hours operation the filtration was stopped and the membrane was kept on the experimental setup for 7 days to mature the fouling by Fe colloids. After the maturation the PF was observed to be 14.90 L m-2 h-1 with respect to DW. Then, the FM was used for the PFR experiment. The membrane was backwashed 2 times with the CAM solution for each 30 minutes, but it was not effective in PFR. Therefore, the CAM solution was thought to be an ineffective chemical in PFR of the FM. The final SRR was found to be 70.0%.
The SRR is usually influenced by colloids fouling [19], applied pressure, cross flow rate, and ionic concentration [20]. In this study the SRR in Runs 9 and 10 were less than that in other runs, because the RO membrane after backwashing was still fouled by Fe colloids in Runs 9 and 10.
Figure 5 shows the relationship between the influent SS concentration and fouling characteristics of a membrane. Here, the operational period of Runs 5, 6, and 7 for fouling were 16, 18, and 16 hours and the influent SS concentration was 300, 136, and 46 mg/L, respectively. The membranes were linearly fouled with the increasing of SS concentration at the R2 value of 0.99. Figure 6 summarizes the PFR rates using different backwashing ingredients. In a series of PFR experiments the effectiveness of DW, SLS, NaOH, and CAM solutions on PFR were examined, in which Runs 5, 6, and 7 were mainly fouled by organic aggregates and Runs 8, 9, and 10 were fouled by Fe colloids. In this study, it was revealed that the single use of DW reached the PFR of 37.0% for the FM mainly fouled by organic aggregates, and the SLS solution showed an anti-behavior on PFR of the FM. However, DW followed by NaOH solution showed better performance in PFR with the PFR rate of 79.4%. Moreover, backwashing with DW recovered the PF of FM by Fe colloids completely, when the backwashing was applied just after fouling.
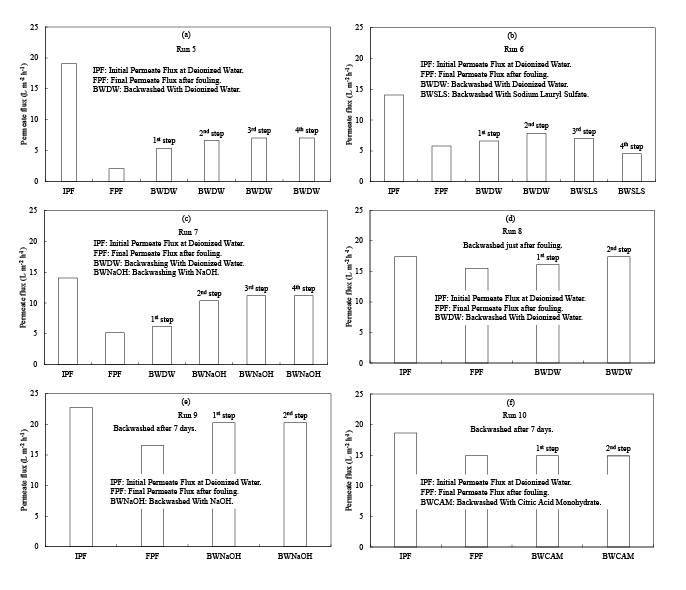
Figure 4: PF changes by each PFR operation. (a) Backwashing by DW (Run 5), (b) Backwashing by DW followed by SLS (Run 6), (c) Backwashing by DW followed by NaOH (Run 7), (d) Backwashing by DW just after fouling (Run 8), (e) Backwashing after 7 days by NaOH (Run 9), (f) Backwashing after 7 days by CAM (Run 10). The RO membranes for Runs 5-7 were mainly fouled by organic aggregates in AW, but that for Runs 8-10 were mainly fouled by Fe colloids.
As a whole, membrane fouling factors are very complicated and it has been widely recognized that electrostatic, hydrophobic, and hydrophilic interactions between membranes and foulants have significantly influenced on membrane fouling. Majority of membranes are fouled by the adsorption of natural organic matter (NOM) and biopolymers. Accordingly, NOM, mainly composed of humic substances, is thought to be a key factor for membrane fouling [21]. The present study also supports the above observations, where organic aggregates principally caused the membrane fouling. However, in the PFR experiments it was observed that the DW removed the foulants deposited on the surface of the membrane like a cake layer, and NaOH had the enhancement effect on the removal of foulants remained after backwashing by DW, probably due to the hydrolyzation and solubilization mechanisms, where, organic matters are hydrolyzed and generate water-soluble soap micelles by the saponification process and negative charges on the organic molecules increase to a great extent [21]. Additionally, hydrolyzed portion of organic matters undoubtedly weakened the bond with the membrane. In addition, the molecules of organic matters stretched in a linear configuration due to the repulsion between negative charged functional groups and membrane. This configuration creates a loose fouling layer that allows molecules to penetrate the inner portion of fouling layer more easily. As a result, NaOH could facilitate the mass transfer and enhance the PFR of a FM [22-24]. On the contrary to the fouling by organic aggregates, the PF of the membrane fouled by inorganic particles, specifically Fe colloids could be recovered completely, if it is backwashed just after fouling with DW (Run 8). This suggested that the membrane fouling by Fe colloids was mainly caused by the physical clogging in the membrane unit. On the other hand, the backwashing after 7-days maturation could not recover the PF completely, even if the NaOH or CAM solution was used (Runs 9, 10). The maturation was expected to transform Fe colloids into Fe oxides. When membrane is fouled by Fe oxides, CAM is expected to be very effective in PFR, because the Fe colloids were transformed into Fe oxides by maturation, which could be dissolved by CAM solution [25]. However, when divalent cations are coexistent with natural organic matters, a denser and more adhesive fouling layer may be formed on the membrane surface. In such CAM may not function at all and alternatively alkaline solution could be effective in removing the inorganic particles of a FM [22]. The present experimental results also support this discussion.
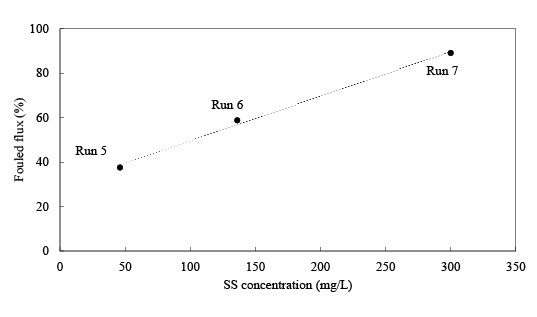
Figure 5: The relationship between the influent SS concentration and fouling characteristics of a membrane.
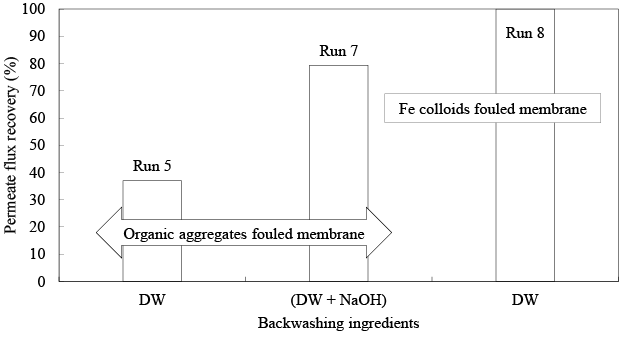
Figure 6: The PFR rate by backwashing with different backwashing solutions.
Nowadays, RO membranes are thought to be a prevalently familiar technology for water treatment in many fields. However, membrane technologies like RO always accompany fouling problems. Therefore, we examined the applicability of a commercially available polyamide RO element to the treatment of synthetic wastewater contaminated with nitrite, nitrate, iron, manganese and municipal sewage-derived contaminants, and sought an effective permeate flux recovery method for a fouled membrane. The RO membrane was able to reject SS, BOD, COD, and TC completely. Besides, the ions rejection rates were 98% for iron, 97% for manganese, 94% for chloride, 80% for nitrite, and 77% for nitrate, respectively. NH4 + rejection rate was found to be poor and it was only 45% probably due to its small molecular weight. Overall, the permeate water quality of the RO treatment is within the Bangladesh permissible drinking water quality standards except NH4 + [26]. Hence, a pre- or posttreatment like breakpoint chlorination would be required for the removal of NH4 + before the final consumption. Influent water containing organic aggregates and inorganic particles like Fe colloids were responsible for the membrane fouling, whereas DM in influent water (EC=640 µS/cm) did not take part in membrane fouling. The backwashing operation through the concentrate port could improve the PF of RO membranes fouled by organic aggregates to the PFR rate of 37.0% using DW and 79.4% using DW followed by the NaOH solution with the concentration of 1000 mg-NaOH/L. The hydrolyzation and solubilization of organic matter by NaOH was inferred to be responsible for the efficacy of NaOH in PFR. On the contrary, the PF of RO membrane fouled by inorganic particles like Fe colloids was completely recovered by the backwashing using DW, when the backwashing was applied just after the fouling. This suggested that the membrane fouling by Fe colloids was mainly caused by the physical clogging in the membrane element.
Download Provisional PDF Here
Aritcle Type: Research Article
Citation: Ashadullah A.K.M., Kishimoto N (2016) Applicability of a Reverse Osmosis (RO) Membrane to the Treatment of Wastewater Contaminated with Nitrite, Nitrate, Iron and Manganese. Int Water Wastewater Treat 2 (1): doi http://dx.doi.org/10.16966/2381- 5299.115
Copyright: © 2016 Ashadullah A.K.M., et al. This is an open-access article distributed under the terms of the Creative Commons Attribution License, which permits unrestricted use, distribution, and reproduction in any medium, provided the original author and source are credited.
Publication history:
All Sci Forschen Journals are Open Access