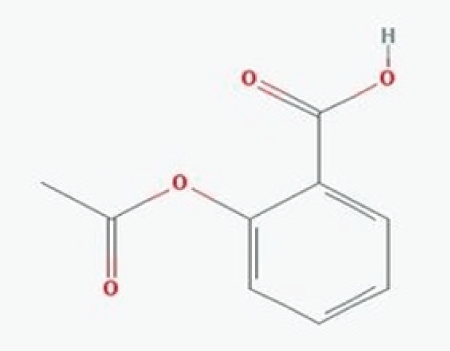
Figure 1: Structure of Aspirin: (Physical state-White crystalline powder; Nature-Weakly acidic; Molecular formula-C9H8O4 ; Molecular mass- 180.157 g/mol; Melting point-135°C; Boiling point-140°C).
Ochieng Anthony1* Hemed S Moh’d1 Mataka A Mataka1 Abdul Juma2 Ochieng J Odalo3 Okoli C Peter4
1Department of Science, Sumait University, Tanzania*Corresponding author: Ochieng Anthony, Department of Science, Sumait University, Tanzania, Tel: +255 776 051 108; E-mail: d_norbatus@yahoo.com
Aspirin, Acetyl salicylic acid or 2-acetoxybenzoic acid, has the carboxylic acid functional group hence easier to quantify using a strong alkali like NaOH. In most analgesic drug formulations in tablets form, aspirin is generally bind or compounded with other excipients or substituents which are acidic in nature and has acidic groups thus reacts easily with NaOH, hence making sodium hydroxide not a suitable reagent for quantifying aspirin in multicomponent aspirin tablet formulation. Six different tablets from reputable drug manufacturing company containing aspirin as an active substance were taken. Methods using sodium hydroxide as the main reagent in quantification involves a lot of stoichiometric mathematical manipulations as in case of titrimetric method while UV-VIS spectroscopy via multivariate calibration gave values at lower limit or outside the lower limits of US & BP pharmacopeia with respect to label claims, while the hyphenated chromatographic techniques such as, GCMS and HPLC gave a very good resolution and very precise results within the pharmacopeia limits.
Pharmacopeia limits; GC-MS; HPLC; UV- VIS Spectroscopy; Titrimetry; Aspirin; Excipients
The pharmaceutical activity of a drug formulation depends upon the chemical characteristics of drug molecules, thus any small variation in chemical properties and quantitative composition may lead to considerable variation in therapeutic effects. Aspirin, an anti-inflammatory drug, produces analgesia both peripheral and CNS effects and inhibits platelet aggregation by irreversible inhibition of platelet cyclooxygenase, inhibits the generation of thrombooxygenase A2, relieves headaches, neuralgia, rheumatism, hence a powerful inducer of platelet aggregation and vasoconstriction.
Aspirin overdose has potentially serious consequences leading to significant morbidity and death (Figure 1). Patients with mild intoxication frequently have nausea and vomiting, abdominal pain, lethargy, ringing in the ears, and dizziness. More significant signs and symptoms occur in more severe poisonings and include high body temperature, fast breathing rate, respiratory alkalosis, metabolic acidosis, low blood potassium, low blood glucose, confusion, seizure cerebral edema, hallucinations and coma. The most common cause of death following an aspirin overdose is cardiopulmonary arrest usually due to pulmonary edema [1]. Thus, a proper assay and quantification technique to ascertain aspirin content in a multi-component pharmaceutical dosage and its stability is indeed necessary, vital and appreciated in order to avoid overdose.
Figure 1: Structure of Aspirin: (Physical state-White crystalline powder; Nature-Weakly acidic; Molecular formula-C9H8O4 ; Molecular mass- 180.157 g/mol; Melting point-135°C; Boiling point-140°C).
Several methods has been put forward for determination of aspirin content as an individual or combined dosage in commercial tablets using various techniques as described [2-7]. A specific analytical method for determining aspirin in multi-component drug based on liquid chromatographic techniques has also been reported [8]. More rapid and specific methods has also been developed based on hyphenated chromatographic techniques [9,10] and UV spectrophotometric flow through multi-parameter sensor [11] Stability studies using HPTLC method for determination of aspirin and clopidogrel bisulphate in combine dosage form has been presented [12] but have not taken into consideration effects of acidic excipients on the final assay
Titrimetry or wet analytical classical techniques and UV spectrophotometric analyzes are often preferred for quality control testing of aspirin in most pharmaceutical and chemical laboratories due to their broad availability, easy to operate and cost effectiveness [4]. Most of these pharmaceutical analytical techniques targets mainly the active ingredient but does not give much attention to effects of the drug constituents that plays other roles which facilitates drug metabolism activities and stability of active substance(s) within the drug formulation. This research compares techniques used in analyzing and quantifying aspirin in various pharmaceutical analgesic formulations and concludes on the best method that can be relied upon to give good resolution and best results within the accepted pharmacopeia limits.
Glass ware used for titrimetry analysis, UV-VIS Double beam Shimadzu 1800 (tra-0% - 400%), FT-IR 8101 M Shimadzu Spectrophotometer (4600-400 cm-1) HPLC Knauer [auto sampler 3900 comp., column LI C18 (ODS), sonycate/karlkotl vibrator, UV-VIS detector]. Reagents used in HPLC are HPLC grade, while for titrimetry are analytical grade (AR) and spectroscopic grade in case of UV –VIS spectroscopic Double beam machine.
The six pharmaceutically formulated drug samples containing aspirin for this study was collected from various pharmaceutical shops within the market are reported in the (Table 1) below.
| Trade Name | Contents | Manufacturer | Place of Collection |
| Aspro | Aspirin 250 mg | Pirimal ltd Ind. lot 2E Exp. Oct 2019 | Royal Pharm, ZNZ |
| Paracetamol 20 mg | |||
| Hedapen | Aspirin 300 mg | Elys Chem. Ind. Ltd BN.3l57 Exp. ss11/17 | Faud Pharm. ZNZ |
| Paracetamol 250 mg | |||
| Caffeine 30 mg | |||
| Ascard-75 | Aspirin 75 mg | Atco lab. Ltd BN. 16047, Exp 04/19 | Royal Pharm. ZNZ |
| Micropirin | Aspirin 350 mg | Piramal India, Ltd Exp 11/19 | Winam Pharm. KE |
| Caffeine 20 mg | |||
| Disprin | Aspirin 350 mg | Reckitt & Colman, India ltd Exp. 7/2019 | Lemuma Pharm. KE |
| Citric acid 35 mg | |||
| CaCO3 105 mg | |||
| Dynasprin | Aspirin 60 mg | American Prod., India ltd Exp. 12/18 | Lemuma Pharm. KE |
| Dipyridamole 75 mg |
Table 1: Drug samples containing aspirin for this study
Preparation of Pure Aspirin: Pure aspirin used for quantitative assay was prepared, purified, dried and characterized [13].
Preparation of Pure Aspirin Stock Solution for Uv-Vis spectroscopy: 50 mg of well dried (2 hr, at 105°C, cooled in vacuum desiccators) sample of pure aspirin weighed, transferred into 100 ml volumetric flask, added 70 ml of 0.1N of NaOH, heated on water bath for 10 minutes, cooled to room temperature, filtered (Whatmann filter paper No. 41) and the filtrate further diluted to 100 ml using the 0.1N to give a concentration of 50 mg/100 ml.
Preparation of Aspirin Drugs Samples Working Stock Solutions for Titrimetric Analysis: Ten tablets of each drug were powdered and dried in an oven for a half an hour, an equivalent amount of 50 mg aspirin from the dried sample accurately weighed into a 100 ml volumetric flask diluted with standardized NaOH (0.093N), heated on a water bath for 10 minutes, cooled to room temperature, filtered, the filtrate further diluted to 100 ml using 0.093N NaOH.
Preparation of HPLC Pure Aspirin Standard Stock Solution: 25 mg of pure aspirin weighed, added into a 25 ml volumetric flask containing diluent (HPLC solvent mixture of acetonitrile and formic acid [99:1], volume made to the mark using the diluents to give a stock solution of concentration 1 mg/ml.
Preparation of HPLC Sample Solutions: 20 tablets of each drug powdered separately, dried for 2 hr at 105°C, cooled in a dessicator, quantity equivalent to 50 mg of aspirin transferred into 100 ml volumetric flask added the diluents, sonicated and volume made to the mark using the diluents.
The pure Aspirin prepared was characterized qualitatively by physical constants, ferric chloride test, esterification and IR spectroscopic studies.
IR Spectral Studies: The spectra of the pure drug as KBR pellets in the range 4600 cm-1 - 400 cm-1 shown below (Figure 2). The 3500 cm-1 –2500 cm-1 represents carboxylic acid – OH str, the peak at 1687 shows the characteristic carbonyl of carboxylic acids. The peaks at 1577 and 1581 are aromatic carbon double bond, 1300 cm-1 represent C-O str, 1380 cm-1 represents CH3 sym bending, peak at 755 cm-1 represents. Ortho substituted aromatic ring C-H. The peak at 1754 cm-1 represents carbonyl str. of the ester. Assignment of the peaks made on consultations with the reference from IR data base confirms Aspirin.
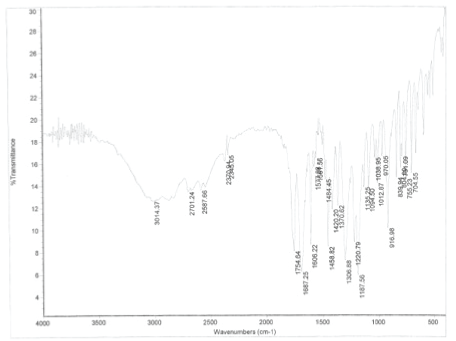
Figure 2: The spectra of the pure drug as KBR pellets in the range 4600 cm-1 – 400 cm-1
Ferric Chloride test: 0.5 gm of pure Aspirin taken into 10 ml test tube, added 10 ml of 5N NaOH, boiled for 3 minutes, cooled, added 10 ml of sulphuric acid, a white precipitate obtained, filtered and dissolved in cold distilled water and added 1 ml ferric chloride solution gave a deep violet coloration confirming the presence of aspirin.
Esterification of Aspirin: 0.5 gm of pure Aspirin taken into 10 ml test tube, added 10 ml of 5N NaOH, boiled for 3 minutes, cooled, added 10 ml of sulphuric acid, a white precipitate obtained, filtered., to the filtrate added 3 ml of alcohol and 3 ml of sulphuric acid, then warmed. The odor of ethyl acetate perceptible from the reaction confirms the presence of aspirin.
Physical parameter: Conformity test: a white crystalline powder, weakly acidic, m.p. 140°C, molecular mass C9H8O4 , exp E1%\1cm nm at E1%\1cm 24.35 and E1cm nm at E1%\1cm 47.6. For this study, E1cm nm at E1%\1cm 24.35 with absorbance at 0.487 taken since it is close to the reported value of λmax = 296 nm at λmax = 297.4 25.
Identification of aspirin from the drug samples: Ferric chloride tests and Esterification test were conducted on the drug samples and all gave positive results confirming the presence of Aspirin in each drug.
Titrimetric assay: The excess alkali in each drug stock solution was titrated with 0.055N HCl using phenolphthalein as the indicator.
UV Spectroscopic assay: 0.1 ml, 0.2 ml, 0.9 ml was pipette out from the pure aspirin stock solution into 10 ml volumetric flasks and diluted to the mark using 0.1N NaOH. Absorbance of each solution noted atλmax = 297.4 nm. This procedure was repeated three times and average results taken to plot a calibration curve. 0.4 ml of each drug stock solution was pipette into 10 ml volumetric flask and diluted to the mark using 0.1N NaOH and absorbance was recorded at λmax = 297.4 nm to estimate the concentration for each. Microsoft excel was used to tabulate the measurement data and perform the linear regression analysis.
HPLC assay: From the HPLC pure aspirin solution, different volumes (0 ml, 1 ml, 2 ml, 6 ml) were taken into different 10 ml volumetric flasks and diluted to 10 ml with the diluents and filtered through a 0.45 µm membrane filter then each dilution injected into HPLC. Flow rate time of 1.9 ml/min, running time of 7 minutes, injection volume 20 µl and detector wavelength 297.4 nm (UV-Visible detector). The mobile phase used was prepared by dissolving HPLC grade sodium heptanes sulfonate 2 gms in a mixture of acetonitrile 150 ml and DI water 850 ml, the pH adjusted to 3.4 using glacial acetic acid. The area under the peak noted. Each of the drug samples is quantified using the same HPLC under the same conditions as above for pure aspirin and the area under the peaks recorded.
The Table 2 below shows results of quantitative determination of aspirin from drug samples. The influence of citric acid also stated since it also consumes NaOH solution in the ratio of 3:1 stoichiometrically.
| Trade Name | Vol. of 0.093N NaOH Consumed by anhydrous Citric acid | Titre value (ml) | Assay of Aspirin | Label Claim | %Error |
| Aspro | - | 22.6 | 229.34 | 250 | -8.26% |
| Hedapen | - | 15.25 | 290.85 | 300 | -3.05% |
| Ascard-75 | - | 41.5 | 71.14 | 75 | -5.15% |
| Micropirin | - | 5.95 | 368.5 | 350 | 5.20% |
| Disprin | 5.87 | 5.32 | 324.8 | 350 | -7.10% |
| Dynasprin | - | 43.35 | 55.66 | 60 | -7.20% |
Table 2: Quantitative determination of aspirin from drug samples
The (Table 3) below shows the absorbance data collected at λmax = 297.4 nm for the pure aspirin and data for its standard calibration curve (Figure 3). * Ycal - mean absorbance, Ycorr - corrected mean absorbance*
| Vol. of stock Sol.Piptd (ml) | Total volume (ml) | Conc × 10-3 mg/ml | Absorbance 1 | Absorbance 2 | Absorbance 3 | Ycal | Y corr | Deviation |
| 0.1 | 10 | 5 | 0.095 | 0.156 | 0.139 | 0.13 | 0.129193 | 0.000807 |
| 0.2 | 10 | 10 | 0.235 | 0.254 | 0.250 | 0.252488 | 0.252488 | -0.00015 |
| 0.3 | 10 | 15 | 0.38 | 0.382 | 0.378 | 0.38 | 0.375783 | 0.004217 |
| 0.4 | 10 | 20 | 0.475 | 0.472 | 0.481 | 0.476 | 0.499078 | -0.02308 |
| 0.5 | 10 | 25 | 0.629 | 0.625 | 0.634 | 0.62933 | 0.622373 | 0.00696 |
| 0.6 | 10 | 30 | 0.757 | 0.759 | 0.754 | 0.756667 | 0.745668 | 0.010999 |
| 0.7 | 10 | 35 | 0.886 | 0.872 | 0.891 | 0.883 | 0.868963 | 0.014037 |
| 0.8 | 10 | 40 | 0.988 | 0.978 | 0.998 | 0.988 | 0.992258 | -0.00426 |
| 0.9 | 10 | 45 | 1.105 | 1.109 | 1.104 | 1.106 | 1.115553 | -0.00955 |
Table 3: Absorbance data for pure aspirin
Different quantities ranging from 15 mg to 35 mg of dried powdered sample of each drug weighed accurately on a watch glass, transferred into 100 ml volumetric flask added 0.1N NaOH to the mark, boiled on a water bath for 10 minutes, filtered, filtrate diluted to 100 ml using NaOH. 0.4 ml of each solution taken into 10 ml volumetric flask and diluted to the mark with 0.1 N NaOH, then absorbance recorded at λmax = 297.4 nm. The results obtained are shown in the (Table 4) below.
| Vol. of stock Sol. Taken (ml) | Volume of diluents added | Total vol. | Conc.(mg/ml) x-axis | The Area under Peak y-axis |
| 0 | 0 | 10 | 0 | 0 |
| 1 | 9 | 10 | 0.1 | 55428.7 |
| 2 | 9 | 10 | 0.2. | 119041.9 |
| 3 | 7 | 10 | 0.3 | 145870.5 |
| 4 | 6 | 10 | 0.4 | 197056 |
| 5 | 5 | 10 | 0.5 | 241416 |
| 6 | 4 | 10 | 0.6 | 306515.2 |
Table 4: Estimated amounts of aspirin using the calibration curve (Figure 3)
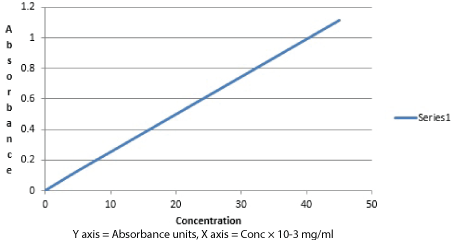
Figure 3:Calibration curve for pure aspirin
Estimation of Aspirin from samples (Weight of the samples taken: X gm; Concentration of Aspirin in the solution: Y mg/ml; Concentration of Aspirin from absorbance: Z mg/ml; Percentage error: [(Y–Z)/Y] × 100).
(Figure 4) below shows the chromatogram of 0.5 mg/ml of pure aspirin solution shown below, flow rate 1.9 ml/min.
The (Table 5) below shows the results obtained using area under the peaks of dilutions from pure aspirin stock solution at different concentrations. The calibration curve was drawn below (Figure 5) by plotting the concentration of aspirin versus the area under the peak (Aup). Each sample solution injected into HPLC machine and their area under the peaks which reflects aspirin content in the drug is elucidated and with the help of the calibration curve (Figure 5), concentration of the aspirin content in the pharmaceutical formulations was determined. The general method used for calculating estimated weight, percentage error and recovery shown (Table 6) below:
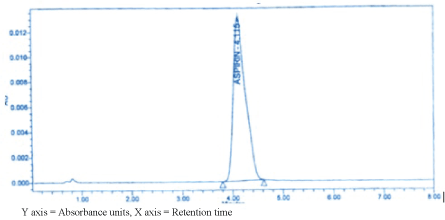
Figure 4: Chromatogram of pure aspirin
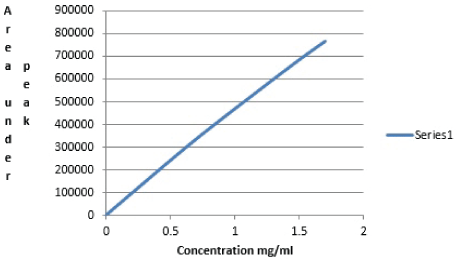
Figure 5: Concentration of aspirin versus the area under the peak (Aup)
| Vol. of stock Sol. Taken (ml) | Volume of diluents added | Total vol. | Conc.(mg/ ml) x-axis | The Area under Peak y-axis |
| 0 | 0 | 10 | 0 | 0 |
| 1 | 9 | 10 | 0.1 | 55428.7 |
| 2 | 9 | 10 | 0.2. | 119041.9 |
| 3 | 7 | 10 | 0.3 | 145870.5 |
| 4 | 6 | 10 | 0.4 | 197056 |
| 5 | 5 | 10 | 0.5 | 241416 |
| 6 | 4 | 10 | 0.6 | 306515.2 |
Table 5: Area under the peaks of dilutions from pure Aspirin stock solution at different concentrations
| Drug Name | Area Under Peak From Chromatogram | Conc. (mg/ml) | Wt. Calculated (mg) |
Recovery % |
Error % |
| Aspro | 685056 | 1.25 | 249 | 99.6 | 0.4 |
| Hedapen | 719859.4 | 1.48 | 295 | 98.3 | 1.7 |
| Ascard-75 | 169876.6 | 0.37 | 74.2 | 98.9 | 1.1 |
| Micropirin | 766038 | 1.7 | 340 | 97.1 | 2.9 |
| Disprin | 7824011 | 1.71 | 342 | 97.7 | 2.3 |
| Dynasprin | 145870.5 | 0.3 | 59.2 | 98.6 | 1.4 |
Table 6: Shows the Area under peaks, Conc (mg/ml), percentage error and recovery
Calculated weight of the sample (Wt):
Wt ꓿ [(conc of the sample x 100)/50] × 100
Error % ꓿ [(Wt-Stdnt Wt)/Stdnt Wt] × 100
Recovery % ꓿ (Ws/Stdnt Wt) × 100
Stdnt. Refers to standard weight*
From the data obtained, as shown in the (Table 7) below, high errors in estimation was realized in titrimetric analysis than in either UVVIS spectroscopic or HPLC techniques. High errors in estimation were realized in titrimetric analysis than in either UV-VIS spectroscopic or HPLC techniques. In drug formulations matrix, in addition to the active ingredients, there are also chemical additives such as binders, diluents, disintegrants, stabilizers, lubricants, coloring and flavoring agents, vehicles and bases which mainly helps in dissolution of the drug activity in our body mechanism, stability and the drug identity [14]. Some of these chemical additives, and excipients have acidic properties and functional group (-COOH) which interfere with estimation particularly while using a strong alkali like NaOH in quantification exercise. Their structural formulations and a well-balanced equation with the estimating reagent (alkali e.g. NaOH, etc) is required for the stoichiometric calculations in order to counter check their interference or effects in estimating aspirin leading to quantitative errors as in the case of titrimetric assay. This is indeed a grueling exercise since it involves stoichiometric estimations encompassed with mathematical manipulations and leading to unavoidable errors. Hence such methods involving neutralization processes in wet classical analytical techniques for estimations should be avoided and discouraged particularly in cases where there are excipients which are acidic in nature.
In case of UV-VIS spectroscopic technique, interference arises mainly when there are absorbing electrons from the drug matrix near the same region with the analyte absorbs the UV radiation resulting into significant errors like in the case of Disprin tablet which has carboxylic groups chromophore within the drug matrix. Despite using calibration curve for quantitative estimations, errors are unavoidable since it is blended with the absorbance readings. Such estimation errors can be avoided, if realized, by isolating the active analyte and quantify. HPLC techniques have proven to be the best according to the data obtain with very good recovery. The peak purity test of aspirin at the stress conditions has revealed that the method was stability indicating and specific. No other peaks at the retention time of aspirin were realized indicating that excipients used in formulations or even its degrading product, be it existing, do not interfere with its estimation. MS/GC proves to be comparable with HPLC but rather laborious and time consuming due to extraction and isolation processes.
| Trade Name | HPLC %Error | UV-VIS Spec. %Error | Titrimetry %Error |
| Aspro | -0.4 | 2 | -8.26 |
| Hedapen | -1.7 | 6 | -3.05 |
| Ascard-75 | -1.1 | -2.5 | -5.15 |
| Micropirin | -2.9 | -2.7 | 5.2 |
| Disprin | -2.3 | -32.8 | -7.1 |
| Dynasprin | -1.4 | 4.8 | -7.2 |
Table 7: Shows the percentage error of HPLC, UV-VIS, Titrimetry
However, with all these techniques, excellent recovery can be achieved if assay is performed on placebo in triplicates before engaging in quantification exercise to countercheck any interference. Hyphenated chromatographic techniques with the help of multivariate calibration curve have proven to be the most reliable for drug quantification studies and should be encouraged. The study finds it necessary for manufacturers to indicate the nature of excipients whether acidic or not, and should have quantitative analytical data of the drug matrix on the literature inserts.
Download Provisional PDF Here
Article Type: Research Article
Citation: Anthony O, Moh’d HS, Mataka MA, Juma A, Odalo OJ, et al. (2017) A Comparative Analysis of Aspirin from Various Analgesic Formulations Using Titrimetry, Spectroscopic and Hyphenated Chromatographic Techniques. J Pharm Anal Insights 2(1): doi http://dx.doi.org/10.16966/2471-8122.113
Copyright: © 2017 Anthony O, et al. This is an open-access article distributed under the terms of the Creative Commons Attribution License, which permits unrestricted use, distribution, and reproduction in any medium, provided the original author and source are credited.
Publication history:
All Sci Forschen Journals are Open Access