Figure 1: Dietary diversity among children in Nairobi County.

Zipporah W Ndungu1 Peter M Chege2*
1Department of Food Science and Technology, Jomo Kenyatta University of Agriculture and Technology, Nairobi, Kenya*Corresponding author: Chege PM, Department of Food, Nutrition and Dietetics, Kenyatta University, GPO Nairobi, Kenya, E-mail: chegepeterm@ gmail.com
School aged children are at a stage of growth that experience changes in biological, psychological and social dimensions. Nutrition inadequacy in this stage affects nutritional status and health and mental outcomes later in life. Dietary assessment is one of the ways of assessing adequacy of diets consumed by children. Minimal information is available on dietary diversity and micronutrient adequacy among school aged children in Kenya. This study provides information about the micronutrients as influenced by dietary diversity. A cross sectional study design was used to collect data on a target sample of 337 children from urban day primary schools in Nairobi City County calculated using Fisher formula. Systematic random sampling was adopted to get the children. Dietary diversity and 24-hour recall questionnaires were used to assess diversity and adequacy of the micronutrients intake. Data from 24-hour recall was analyzed using Nutri-survey computer software. The Dietary Diversity Score (DDS) was calculated from 7 food groups. A score of <4 was considered as low, 4-6 was considered as moderate while a score of >6 were considered as high dietary diversity. Micronutrients adequacy was calculated using Nutrient Adequacy Ratio (NAR) and mean adequacy ratio. Pearson’s correlation was applied to find the relationship between dietary diversity and micronutrients adequacy. The mean DDS was 3.8 ± 1.4 and the mean adequacy ratio was 0.59 as opposed to the required value of 1. The diet was predominantly cereals, legumes and green leafy vegetables. The consumption of Vitamin A rich vegetables and fruits, dairy products and flesh foods was low. The proportion of children who had inadequate intake for various nutrients are: iron (33.7%), calcium (40.1%), zinc (31.7%), Vitamin A (29.8%) and Vitamin B12 (38.1%). Pearson’s correlation coefficient between DDS and NAR was significant for all the nutrients (p<0.05) meaning the higher the diversity score the higher the amount of micronutrients consumed in relation to the recommended levels. The diet of school children in Nairobi County was not diversified. The diet was deficient of crucial micronutrients. The correlation between DDS and the NAR indicated that on increasing dietary diversity, micronutrients adequacy increased. This study recommends promotion of efforts to improve consumption of diversified diets from available local foods to achieve adequate nutrient intake by school children. The commonly consumed foods can be fortified to ensure availability of missing micronutrient.
Dietary diversity; Micronutrients adequacy; School children
The most common problem among school aged children is undernutrition, both underweight and micronutrient deficiency. This is linked to various diseases and mortality in developing countries [1]. It is also associated with a wide range of adverse health outcomes, such as growth restriction, impaired cognition, and increased morbidity and mortality [2]. Nutritional adequacy refers to intake of essential nutrients, required to achieve optimal health. Diversified diets are required to meet the required nutrients [2]. Growth and nutritional status of school aged children is profoundly influenced by the diet consumed [3]. Inadequate micronutrient intakes are primarily responsible for the deficiencies and are attributed to poor quality and monotonous diets [4,5]. Thus, dietary intake data are crucial to understanding the role of the diet in nutritional deficiencies, and eventually to design effective nutritional interventions [6].
Dietary assessment is one of the ways in assessing micronutrient malnutrition. This assessment provides information about the quality of food consumed in terms of micronutrients adequacy of children [7,8]. Further, dietary diversity assessment help determine the risk of deficiency due to low intakes of essential nutrients needed for good health. It also serves as a proxy for measurement of the nutritional quality of an individual’s diet [1] and in determining whether the child’s diet has the important elements needed for growth or not. Eating a wide variety of foods is likely to increase micronutrients adequacy [9].
While there is sufficient information available on the dietary intake of pre-school children from the Kenya health demographic surveys, data is scarce on specific population groups such as school aged children. This study assessed the dietary diversity as a proxy measure of adequacy of micronutrients intake among public school aged children in Nairobi City County. According to a study by Cornelsen L, et al. [10] done in Nairobi, Kenya, a variety of foods are available within Nairobi County. They mainly come from urban farming and from markets through purchasing.
A cross-sectional study design was used to collect data from eight urban day primary schools in Nairobi City County. This was on a randomly selected sample of 337 pre-adolescents children aged 8-11 years. The sample was calculated using fisher formula cited in Mugenda OM and Mugenda AG [11]. A 24-hour dietary recall was administered to the children on two randomly picked weekdays and one weekend day at home. Children were identified at school and followed at home for the administration of 24-hour recall. A detailed description of the foods eaten and amount consumed was estimated by using common household utensils and food photos albums. Dietary diversity was established by assessing the number of food groups consumed by the children using the dietary diversity questionnaire. All the food items consumed by the pupils were categorized into 14 food groups as recommended by FAO Nutrition and Consumer Protection Division [12]. The final DDS was calculated using an aggregated seven food groups, combining certain groups based on the FAO guidelines.
The mean for the three days was calculated. Data was analyzed using Nutri-survey computer software to establish the amount of nutrients consumed in a day. This was then compared with the recommended daily energy and nutrient requirements’ for children by FAO and WHO to determine the adequacy of micronutrients intake [13]. DDS was calculated by awarding a score to each response in the Dietary diversity questionnaire. One point was awarded if food item was consumed and 0 point for food items not consumed. Dietary diversity indicator was the sum of scores in the 7 food groups which ranged from 0-7.
A score of ≤ 4 was considered as low dietary diversity, 4-6 was considered as moderate while a score of >6 were considered as high dietary diversity [12]. Micronutrients adequacy was measured by computing Micronutrients Adequacy Ratio (NAR) for 11 nutrients namely: Calcium, Zinc, Vitamin A, Iron, Folate, Vitamin C, Thiamin, Riboflavin, Niacin, Vitamin B12 and Folate. The NAR for a given nutrient was calculated as the ratio of a child’s intake to the current recommended nutrient intake for each sex and age category which Mean Adequacy Ratio (MAR) was calculated as the an overall measure of the micronutrients adequacy. The formula is;
\[NAR = \frac{{Actual{\rm{ }}nutrient{\rm{ }}intake{\rm{ }}of{\rm{ }}a{\rm{ }}nutrient{\rm{ }}per{\rm{ }}\left( {{\rm{ }}day} \right)}}{{Recommended{\rm{ }}daily{\rm{ }}allowance{\rm{ }}of{\rm{ }}the{\rm{ }}nutrient}}\]
From sample of 337 pre-adolescents children aged 8-11 years 312 completed the study.
The age distribution of the study children was between 8-11 years with 41.0% being 11 years and the mean age of 10.1 ± 0.9. Slightly more than half of the children were girls (53.5%) (Table 1).
| Characteristics | n (312) | (%) | |
| Gender of the children | Boys | 145 | 46.5 |
| Girls | 167 | 53.5 | |
| Age of the children (years) | 8-9 | 79 | 25.3 |
| 10 | 105 | 33.7 | |
| 11 | 128 | 41.0 |
Table 1: Household and children characteristics.
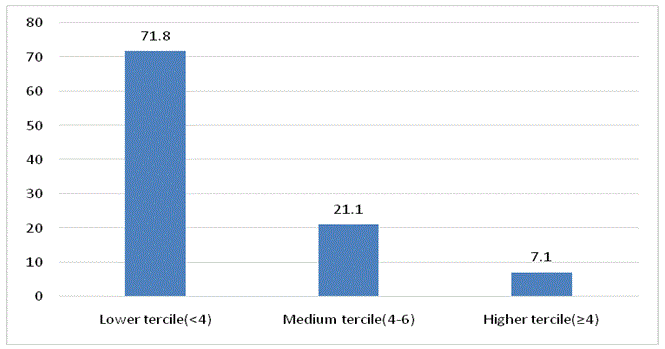
The mean DDS for the children was 2.83 ± 1.4 with majority of the children (71.8%) being in the lower tercile of dietary diversity. In the lower tercile, 12.2% and 59.6% had a DDS of 2 and 3, respectively. Slightly more than a fifth (21.1%) had medium DDS, 4-6 food groups while 7.1% had high DDS (Figure 1). Only 28.9% of the children had achieved the minimum dietary score (children who consumed foods from four or more food groups).
Figure 1: Dietary diversity among children in Nairobi County.
Almost all 99.7% of the children had consumed foods from grains and/or roots and tubers group. Legumes, nuts and seeds were consumed by less than half of the children (44.9%). Slightly more than half (52.9%) and 51.6% of the children had consumed Vitamin A rich fruit and vegetables and dairy products, respectively (Figure 2). There was minimal consumption of flesh foods (23.7%) (Meat, fish, poultry and liver/organ meat) and eggs 17.6% which are rich in iron, Vitamin A, zinc, B12 and calcium which are the crucial micronutrient for this age group. The fact that children consumed foods from almost all groups indicates that the foods can be accessed.
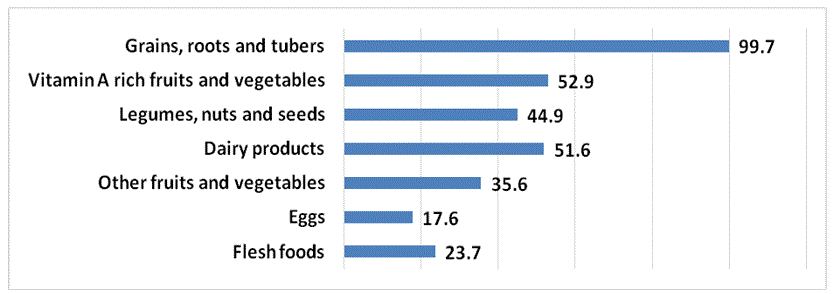
Figure 2: Proportion of children consuming foods from various food groups.
Mean intake of key micronutrients such as Calcium, Iron, Zinc and Vitamin A, Vitamin B12, Folate was significantly lower than the reference value for both boys and girls. For Vitamin C, B1, B2, Niacin and B6 intake was adequate for majority (Table 2).
| Nutrient | Age category | Girls | Boys | ||
| RNI | Mean intake | RNI | Mean intake | ||
| Iron (g) | 8-9 | 8.9 a | 5.7 ± 1.2 | 8.9 a | 6.3 ± 2.3 |
| 10-11 | 14.6 a | 8.6 ± 2.4 | 14 a | 7.2 ± 3.7 | |
| Calcium (g) | 7-9 | 700 | 407.34 ± 89.7 | 700 | 384.67 ± 98.76 |
| 10-11 | 1300 | 655.56 ± 123.5 | 1300 | 747.78 ± 134.23 | |
| Zinc (g) | 7-9 | 11.2 b | 5.8 ± 2.3 | 11.2 b | 6.5 ± 1.4 |
| 10-11 | 14.4 b | 7.8 ± 2.9 | 17.1 b | 8.8 ± 2.9 | |
| Vitamin A (ug) | 7-9 | 500 | 288.6 ± 78.7 | 500 | 294 ± 34.6 |
| 10-11 | 600 | 347.7 ± 112.4 | 600 | 303.56 ± 77.34 | |
| Vitamin C (mg) | 7-9 | 35 | 31.3 ± 6.5 | 35 | 29.4 ± 5.6 |
| 10-11 | 35 | 30.7 ± 5.5 | 35 | 31.5 ± 9.7 | |
| Vitamin B1(mg) | 7-9 | 0.9 | 0.73 ± 0.12 | 0.9 | 0.8 ± 0.1 |
| 10-11 | 1.1 | 0.74 ± 0.13 | 1.2 | 0.7 ± 1.21 | |
| Vitamin B2 (mg) | 7-9 | 0.9 | 0.67 ± 0.12 | 0.9 | 0.65 ± 0.2 |
| 10-11 | 1 | 0.85 ± 0.15 | 1.3 | 1.04 ± 0.9 | |
| Niacin (mg) | 7-9 | 12 | 8.7 ± 2.5 | 12 | 7.95 ± 2.7 |
| 10-11 | 12 | 8.6 ± 3.4 | 12 | 9.52 ± 3.4 | |
| Vitamin B6 (mg) | 7-9 | 1 | 0.74 ± 0.14 | 1 | 0.741 ± 0.3 |
| 10-11 | 1.2 | 0.97 ± 0.23 | 1.3 | 1.05 ± 0.91 | |
| Folate (mg) | 7-9 | 0.3 | 0.24 ± 0.01 | 0.3 | 0.23 ± 0.01 |
| 10-11 | 0.4 | 0.5 ± 0.04 | 0.4 | 0.31 ± 0.02 | |
| Vitamin B12 (mg) | 7-9 | 1.8 | 1.3 ± 0.1 | 1.8 | 1.4 ± 0.5 |
| 10-11 | 2.4 | 1.6 ± 0.23 | 2.4 | 1.62 ± 0.8 |
Table 2: Mean micronutrient intake for both girls and boys.
FAO/WHO/UNU, 2002; WHO/FAO 2004 [13]
a: Iron RNI Based on a 10% bioavailability level
b: Zinc RNI Based on a low bioavailability level
On average, more than a third of the school children had inadequate intake of various nutrients; iron (33.7%), calcium (31.7%), zinc (40.1%), Vitamin A (29.8%) and Vitamin B12 (38.1%) (Table 3). This could be associated with minimal consumption of animal products.
| Micronutrient | Adequate | Inadequate | ||
| n | % | n | % | |
| Iron | 207 | 66.3 | 105 | 33.7 |
| Calcium | 213 | 68.3 | 99 | 31.7 |
| Zinc | 187 | 59.9 | 125 | 40.1 |
| Vitamin A | 219 | 70.2 | 93 | 29.8 |
| Vitamin C | 226 | 72.4 | 86 | 27.6 |
| Vitamin B1 | 250 | 80.1 | 62 | 19.9 |
| Vitamin B2 | 238 | 76.3 | 74 | 23.7 |
| Niacin | 235 | 75.3 | 77 | 24.7 |
| Vitamin B6 | 210 | 67.3 | 102 | 32.7 |
| Folate | 226 | 72.4 | 86 | 27.6 |
| Vitamin B12 | 193 | 61.9 | 119 | 38.1 |
Table 3: Proportion of children with adequate intakes of selected micronutrients.
Dietary diversity predicted intake of various nutrients (Table 4). Micronutrients adequacy ratio for calcium was (0.53), zinc (0.50), B12 (0.58), iron (0.52), Vitamin A (0.54) which was low. This could be attributed by minimal consumption of animal products and Vitamin A rich fruits and vegetables. For Vitamin B complexes there was moderate adequacy in relation to RNI except B12. Vitamin C had the highest adequacy ratio. The mean MAR was 0.59 as opposed to required value of 1 for a diet that covers the recommended intake for all the nutrients considered.
| Mean Nutrient intake | Nutrient adequacy ratio | Correlation coefficient with dietary diversity score |
| Calcium | 0.53 | r=0.395; p<0.001 |
| Zinc | 0.50 | r=0.350; p<0.001 |
| Vitamin B12 | 0.59 | r=0.324; p<0.001 |
| Folate | 0.62 | r=0.212 p<0.001 |
| Vitamin C | 0.75 | r=0.293; p=0.001 |
| Iron | 0.52 | r=0.313; p<0.001 |
| Vitamin A | 0.53 | r=0.289; p<0.001 |
| Thiamine | 0.69 | r=0.193; p=0.047 |
| Riboflavin | 0.68 | r=0.164; p=0.030 |
| Niacin | 0.69 | r=0.143; p=0.023 |
| Vitamin B6 | 0.64 | r=0.136; p=0.035 |
| Mean Adequacy ratio | 0.59 |
Table 4: Relationship between DDS and micronutrients adequacy ratio.
Lack of dietary diversity is particularly a considerable problem among poor populations in the developing world as their diets are predominantly based on starchy staples [14]. In developing countries dietary diversity is given greater importance especially to address nutritional deficiencies and there is widespread recognition that low dietary diversity is associated with chronic nutritional deficiencies [6].
In this study, the dietary diversity of children was assessed using individual dietary diversity questionnaire, over a 24 hour period for 3 different days as a means of determining quality of the diets. The individual dietary diversity score gives a reflection and an estimate of micronutrients adequacy of one’s diet [15].
The average dietary diversity score for the children in the study was 3.8 ± 1.4 with only 22.8% of the children having the acceptable recommended dietary diversity score of four (4) or more [12]. The mean adequacy ratio of this study population was 0.59 (59%) and there was a positive correlation between DDS and adequacy of micronutrients intake where children in low diet diversity had inadequate intake of various micro-nutrients. A diet that covers the recommended intake for all considered nutrients should have a MAR of 1[16].
A study in Western Kenya conducted among pre-school noted a strong relationship between dietary diversity and micronutrients adequacy among children [17]. Another study in South African children among 1-8 years has found strong relationship between dietary diversity and micronutrients adequacy among children [18]. Similarly, a study in India conducted among school aged children noted a strong relationship between dietary diversity and micronutrients adequacy among children [19].
High dietary diversity has been previously associated with positive outcomes such as high nutrient intake, improved child anthropometric measurements, improved hemoglobin levels and reduced mortality [20]. Many dietary guidelines also recommend inclusion of a variety of foods in the diet, which is associated with adequate intake of all the essential nutrients [21]. The low DDS in this present study is an indication that children in the study area are not likely to meet adequate micronutrient requirement for growth. Children need to be fed a wider variety of foods since an increase in individual dietary diversity score shows a corresponding increase in nutrient intake [17].
In the present study, grains, root and tubers consumption was 99.7% and almost all other food group consumption was low especially animal products. Flesh foods and eggs were only consumed by less than a third of the population and most of proteins consumed were mainly from plant origin. Low intake of meat and meat products cannot be overlooked because they are a rich and superior source of many micronutrients such as Calcium, Iron, Zinc, Vitamin A and B12. The daily consumption of fruits and vegetables was generally low; Vitamin A rich fruits and vegetables 52.9%, other fruits and vegetables 35.6%. Low percentages of individuals consuming food groups containing these crucial micronutrients on a given day may be indicative of seriously inadequate diets that lead to morbidity related to micronutrient deficiencies. Such habits of low consumption of flesh foods fruits and vegetables have been identified by Olwande J [22] in a study in Kenya, Fruits and vegetables are rich sources of minerals and vitamins which are bio-available. Milk added to coffee/tea was the only source of dairy products consumed by the children.
There was inadequate consumption of key micronutrients such as Zinc, Calcium, Vitamin A, Folate, Vitamin B12 and Iron by approximately a third of the study population. This can be explained by the fact that the diet of the children was deficient of animal proteins which are good sources of Vitamin B12, iron and zinc and calcium. Nutrient intake below the recommended level of intake can cause deficiency with or without discernable clinical signs and with potential adverse nutritional and health consequences [9]. Deficiency of certain nutrient in a certain stage in lifecycle will be carried to the next stage in the life cycle. The study group was pre-pubertal and is likely to move to adolescent stage with inadequacy of these micronutrients. Adolescent girls require iron to cater for menstrual loses, zinc is also required for maturation of sex hormones among boys, and calcium is needed for building the bone density and protein to cater for accelerated growth.
It was evident that the diet of the children was deficient in terms of micronutrient and lacked diversity. Currently Kenya urban population is facing dietary transition with increased access to cheap food outlets selling mainly starchy foods which are devoid of nutrients but dense in terms of energy. This may be a possible explanation why this study population had a substantial proportion not meeting micronutrients recommendations.
The DDS of school children in Nairobi City County was low for majority of the children. DDS was positively associated with micronutrients adequacy indicating that the higher the dietary diversity score, the more the amount of micronutrients consumed. Cereals, roots and tubers were frequently consumed with eggs and flesh foods being consumed less frequently. The mean intake for Calcium, Iron, Zinc and Vitamin A, B12 and Folate was lower than the reference values.
This study recommends promotion of efforts to improve consumption of diversified diet to achieve adequate diets by school children.
Ethical approval was obtained from Kenyatta University Ethical Review (PKU/242/218). The head teachers and parents were given an informed consent form to sign prior to the study. All participating children were given a written assent form to sign after being informed of procedures and purpose of the study.
The authors declare that they have no competing interests.
Acknowledged is Kenyatta University as the coordination center. Research assistants are thanked for their assistance in data collection and analysis. The teachers of study schools and study children are greatly thanked for responding to data collection tools. Parents and guardians to the study children are acknowledged for consenting to this study.
Download Provisional PDF Here
Article Type: RESEARCH ARTICLE
Citation: Ndungu ZW, Chege PM (2019) Dietary Diversity and Micronutrients Adequacy of Diets Consumed by School Aged Children in Nairobi City County, Kenya. Nutr Food Technol Open Access 5(1): dx.doi.org/10.16966/2470-6086.156
Copyright: © 2019 Ndungu ZW, et al. This is an open-access article distributed under the terms of the Creative Commons Attribution License, which permits unrestricted use, distribution, and reproduction in any medium, provided the original author and source are credited.
Publication history:
All Sci Forschen Journals are Open Access