Introduction
Microglial responses critically underpin pathological processes associated with progressive neurodegenerative diseases such as Alzheimer’s disease, AD [1]. Regulated inflammation is essential in the healthy brain for the removal of debris, apoptotic cells and the neutralisation of infection. However, prolonged inflammation, often attributed to dysregulated microglial activation, may be detrimental to the long-term health of the brain and is implicated in the pathogenesis of multiple neurodegenerative diseases. Recent genome-wide association studies (GWAS) have identified single nucleotide polymorphisms (SNPs) in the gene encoding the triggering receptor expressed on myeloid cells (TREM2) as putative risk factors for late-onset Alzheimer’s disease (LOAD) [2,3]. TREM2 is a major microglia-specific gene, ranked #31 of the most highly expressed microglia genes and acts as a hub gene in microglia [4]. Mutations in the TREM2 gene are thought to result in loss-of function of TREM2 in LOAD [2,3,5] as well as Nasu-Hakola disease (NHD; also referred to as polycystic lipo membranous osteodysplasia with sclerosing leukoencephalopathy (PLOSL)) and both diseases result in progressive, unrelenting dementia [6,7].
Normally, TREM2 may act as a lock to suppress microglial proinflammatory activity, whilst promoting protective microglial responses such as chemotaxis and phagocytosis. In the current study, TREM2 knockdown microglial cell lines were generated using CRISPR/cas9n gene editing of the mouse BV2 microglial cell line. These cell lines were then used for functional experiments in an attempt to further appreciate the role of TREM2. Following heterozygous or homozygous knockdown of TREM2, microglia displayed functional deficits of membrane ruffling, filopodial extension and phagocytosis. Furthermore a decreased expression of Ionized calcium binding adaptor molecule 1 (Iba1) was observed, supporting a suggestion of defective cytoskeletal control in cells lacking TREM2.
Results
Following one round of CRISPR-Cas9n modification and subsequent Sanger sequencing, 2 BV2 clones were selected, which we have termed Clone A7 and C8. These were designated as knockdowns (KD). A second round of CRISPR modification using clone C8 produced two knockout (KO) clones which we termed B5 and G4 (Figures 1a and 1b). These clones were used in all subsequent experiments together with wild-type (WT) cells. Characterisation of these cells revealed a significant decrease in the levels of deglycosylated TREM2 for the A7 and C8 clones and a lack of deglycosylated TREM2 in the G4 and B5 clones (Figures 2a and 2b). The mRNA expression was also significantly decreased when compared with WT (Figure 2c) as was soluble shed TREM2 (sTREM2), (Figure 2d). Immunolocalisation of cellular TREM2 indicated that in WT cells, TREM2 appeared to be highly localised to the Golgi, adjacent to the nucleus; however this staining was absent from the A7 and C8 clones (Figure 3a), and the G4 and B5 knockout clones (Figure 3b). Subsequently we observed differences in the morphology of these cells following plating (Figures 4a and 4b) and determined whether TREM2 knockdown and knockout had an adverse effect on filopodial formation. Analysis of filopodial length indicated that the knockdown and knockout clones showed a significant decrease in their overall filopodial lengths to approximately 2 μm compared with an average filopodial length of 3.5 μm in WT (Figure 4c). This was not reflected in a reduction in filopodial number for any of the clones compared with WT (Figure 4d) but further analysis revealed that the ability of the clones to produce filopodia of 5-10 μm or 10-15 μm was also significantly reduced compared with WT (Figure 4e).
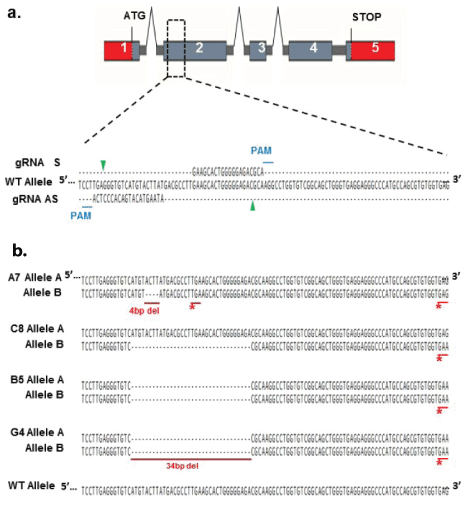
Figure 1: CRISPR/Cas9 nickase modification of the Trem2 gene in BV2 cells.
a. Schematic of the mouse Trem2 locus and CRISPR/Cas9 nickase modification strategy. gRNAs are aligned to their target sequences on exon 2 of the Trem2 gene. Protospacer-adjacent motifs (PAM) for each gRNA are marked with a blue line and nicking sites are indicated by green arrows.
b. Sequence alignment of the WT Trem2 sequence and Trem2 CRISPR mutants. Clones A7 and C8 were obtained during a first round of CRISPR modification, while clones B5 and G4 were obtained during a second round of CRISPR modifications using the clone C8 as the starting cell line. Nucleotide deletions are labelled in red as well as the newly generated stop codons (*).
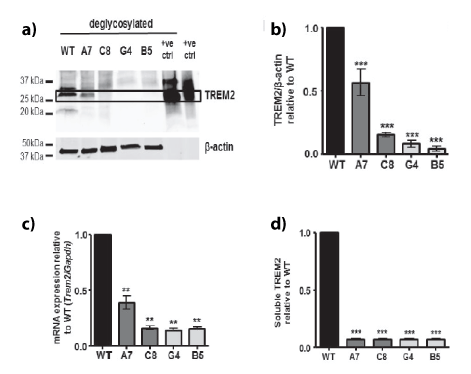
Figure 2: Characterisation of TREM2 knockdown and knockout clones generated using CRISPR/Cas9 modification.
a. Representative Western blot of TREM2 expression in wild-type (WT), TREM2 knockdown (A7 and C8 clones) and TREM2 knockout (G4 and B5 clones) CRISPR-edited BV2 cells. Treatment of lysates with PNGase to deglycosylate proteins was performed to accurately quantify total TREM2 protein levels. Recombinant extracellular mouse TREM2 was used as the positive control.
b. Densitometric analysis of TREM2 protein expression levels. Graph represents protein level relative to WT. Values were normalised to β-actin levels. Values are expressed as mean ± SEM for 3 individual experiments, ***ρ<0.001; one way ANOVA with Dunnett’s multiple comparison test.
c. Trem2 mRNA expression normalised to Gapdh mRNA expression. Values relative to WT levels expressed as mean ± SEM for 3 individual experiments (**p<0.01; one way ANOVA with Dunnett’s multiple comparison test).
d. Soluble TREM2 (sTREM2) secretion levels determined by ELISA. Graph represents sTREM2 level relative to wild type (WT). Values are expressed as mean ± SEM for 3 individual experiments, ***ρ<0.01; one way ANOVA with Dunnett‘s multiple comparison test.
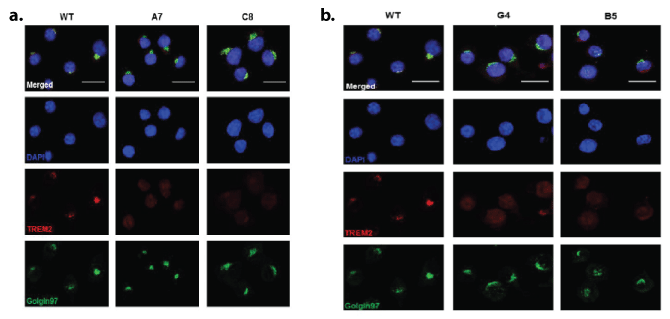
Figure 3: Characterisation of TREM2 cellular expression by immunolocalisation in WT, knock-down and knock-out BV2 microglial clones. Representative images of immunofluorescence localisation of TREM2 (red), golgi complex (Golgin97; green) and DAPI (blue) illustrating the differences in TREM2 staining intensity and cellular localisation in the
a. wild type (WT), TREM2 knockdown (A7 and C8)
b. WT, TREM2 knockout (G4 and B5) cell lines. Top panel shows merged images. Scale bar represents 25 μm.
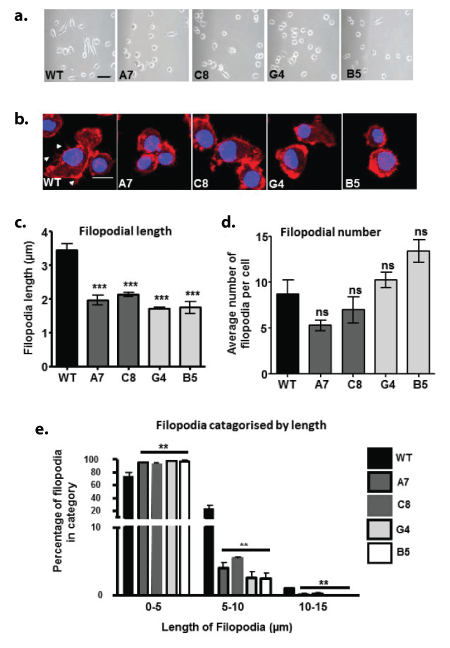
Figure 4: The effects of TREM2 KD/KO on cytoskeletal structures in BV2 microglial cells
a. Representative phase contrast images of wild-type (WT), TREM2 knockdown (A7 and C8) and TREM2 knockout (G4 and B5) CRISPR-edited BV2 microglial cell lines. Scale bar represents 100 µm.
b. Representative confocal microscopy images of BV2 cell lines labelled with phalloidin-568 (red) to visualise f-actin and DAPI (blue) to visualise the nucleus. Scale bar represents 20 µm. Arrow heads show filopodia.
c. Quantification of the length of filopodia on the cell surface, visualised with phalloidin stain for F-actin.
d. Quantification of the number of filopodia on the surface of each cell.
e. Quantification of the length of filopodia that fit into the length categories of 0-5 µm, 5-10 µm or 10-15 µm for each cell line. For the purpose of performing statistical analysis, the percentage of filopodia in each category was tested against the WT values for that length category.
Analysis of morphological changes following LPS stimulation (1 μg/ml for 24 h) also revealed changes amongst the clones compared with WT (Figure 5); there was a significant reduction in the number of cells displaying a bipolar morphology following LPS stimulation in all clones compared with WT (Figures 5a and 5b). Furthermore, exploration of the response of the cells to ATP (50 µM, 5 min) or MCSF (100 ng/ml, 5 min) revealed changes in the ability of the cells to produce ruffles, wave-like structures formed by detachment and movement of the extended cell edges [8] (Figure 6a). Whilst the percentage of cells with ruffle morphology was not significantly altered under basal, unstimulated conditions, the ability of ATP (Figures 6a and 6b) or MCSF (Figure 6a and 6c) to produce ruffles was significantly inhibited in the knockdown and knockout clones compared with WT stimulated cells. F-actin in the membrane ruffles induced by MCSF treatment co-localised with Iba1 in BV2 cells, confirming that the structures seen in this study are membrane ruffles as reported elsewhere [8,9]. Since Iba1 has been shown to be critical for ruffle formation, we analysed the expression levels of this protein (Figures 7a-7d) as well as the mRNA for the gene Aif1 which encodes for Iba1 (Figure 7b). In all KD/KO clones, the levels of Aif1 mRNA (Figure 7b) and Iba1 protein were significantly reduced compared with WT (Figures 7c and 7d). Interestingly mRNA levels of the actin gene Actb showed no significant difference between the clones (Figure 7e). Since the secretion of sTREM2 is significantly reduced in all the clones (Figure 2d), we analysed whether the addition of microglial conditioned medium (MGCM) from WT BV2 cells, which contains 150 ng/ml sTREM2 (Figure 2d), to B5 microglia, in which the MGCM contains barely detectible levels of sTREM2 with our assay, 3ng/ml, (Figure 2d), and which display the most extreme deficits in membrane ruffling (Figures 6b and 6c), was able to rescue the B5 clone in terms of its ability to produce membrane ruffles in response to MCSF (Figure 7f). Neither pre-treatment with WT-MGCM nor B5-MGCM could restore the ability to form membrane ruffles in response to MCSF treatment in the B5 cells, with the percentage of B5 cells with ruffling morphology still remaining significantly lower than WT cells for all treatment conditions (Figure 7f). Furthermore, pre-treatment with MGCM from either cell type had no effect on the formation of membrane ruffles by the WT cells (Figure 7f).
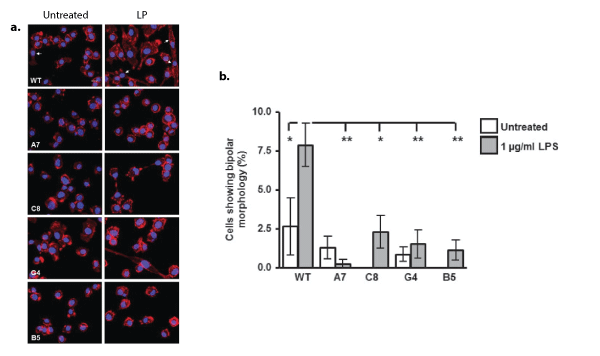
Figure 5: Effect of TREM2 KD/KO on microglial bipolar morphology following stimulation with Lipopolysaccharide.
a. Representative images of immunofluorescence labelling of F-actin using phalloidin(red) in BV2 cells treated with lipopolysaccharide (LPS, 1 µg/ml) for 24 hours. Arrowheads indicate cells with bipolar morphology.
b. Quantification of the percentage of cells with bipolar morphology following 24 hours of stimulation with 1 µg/ml LPS. Values are expressed as mean percentage ± SEM for 3 individual experiments with a minimum of 5 fields of view analysed per experiment, *ρ<0.05, **ρ<0.01; one way ANOVA with Dunnett‘s multiple comparison test.
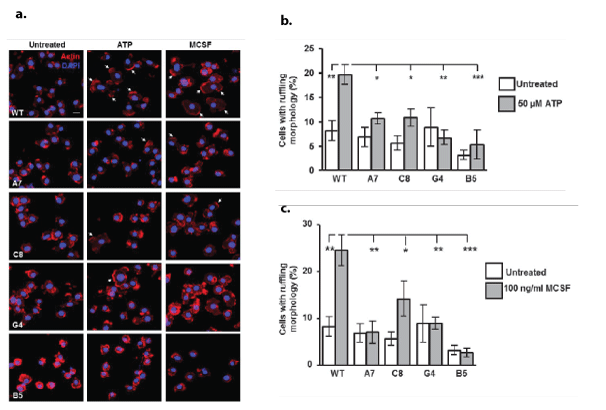
Figure 6: Effect of TREM2 KD/KO on microglial ruffle formation following stimulation with ATP or MCSF
a. Representative images of immunofluorescence labelling of F-actin using phalloidin-568 (red) with DAPI counterstain (blue) in BV2 cells treated with 50 µM ATP or 100 ng/ml MCSF, for 5 min. Arrowheads indicate membrane ruffle morphology. Scale bar represents 20 μm.
b. Quantification of the percentage of cells with membrane ruffling morphology following 5 minutes of stimulation with 50 µM ATP. Values expressed as mean percentage ± SEM for 5 individual experiments with a minimum of 5 fields of view analysed per experiment, *ρ<0.05, **ρ<0.01; one way ANOVA with Dunnett‘s multiple comparison test. For the purpose of performing statistical analysis, the percentage of cells with ruffling morphology following treatment with ATP for each cell clone was compared with the percentage in untreated cells of the same clone.
c. Quantification of the percentage of cells with membrane ruffling morphology following 5 minutes of stimulation with 100 ng/ml MCSF. Values expressed as mean percentage ± SEM for 5 individual experiments with a minimum of 5 fields of view analysed per experiment, *ρ<0.05, **ρ<0.01, ***ρ<0.001; one way ANOVA with Dunnett‘s multiple comparison test.
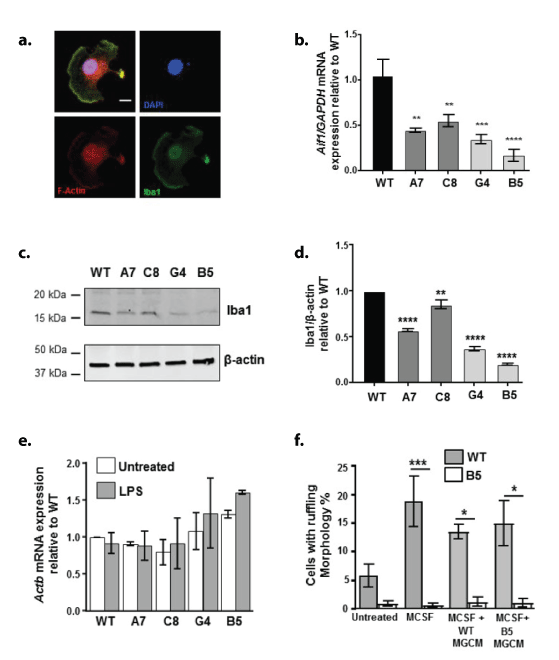
Figure 7: The effect of TREM2 KD/KO on membrane ruffles, Iba1 expression and rescue attempts with sTREM2.
a. Representative images of immunofluorescent labelling of F-actin (red), Iba1 (green) and DAPI (blue) illustrating the colocalisation of Iba1 in the F-actin rich membrane ruffles in WT BV2 cells stimulated with 100 ng/ml MCSF for 5 min. Scale bar represents 10 μm.
b. qPCR of Aif1 mRNA expression levels in wild type (WT), TREM2 knockdown (A7 and C8) and TREM2 knockout (G4 and B5) BV2 cells. Graph represents Aif1 mRNA normalised to Gapdh mRNA expression, relative to WT levels.
c,d. Representative western blot and subsequent densitometry analysis of Iba1 expression in WT, TREM2 knock down (A7 and C8) and knockout (G4 and B5) cells. Graph represents protein level relative to WT. Values were normalised to β-actin levels. Values are the mean ± SEM for 3 individual experiments **ρ<0.01, ***ρ<0.001, ****ρ<0.0001; one way ANOVA with Dunnett’s multiple comparison test.
e,f. qPCR analysis of β-actin mRNA (Actb) expression levels in WT vs KD and KO clones, Values are the mean ± SEM for 3 individual experiments. Data analysis revealed no significant difference, one way ANOVA with Dunnett’s multiple comparison test.
Since cytoskeletal reorganisation is required for phagocytosis, a major function of microglia in vivo, we analysed the ability of the different clones to phagocytose pHrodo E.coli by FACS analysis (Figure 8). The particles have the advantage of only fluorescing once inside an acidic environment, such as that of a lysosome, thus removing background signal from cell surface binding by the beads. A further control of cytochalasin-D treatment was also used, which inhibits actin polymerisation thus preventing the changes in cell structure required for phagocytosis. The A7 and C8 KD clones did not show a significant difference compared with WT in their ability to phagocytose pHrodo E.coli, (Figure 8a). However, the TREM2 KO clones G4 and B5 displayed a significantly lower level of phagocytosis compared with WT cells, as determined by the mean fluorescence signal from FACS analysis of the cells (*p<0.05, **p<0.01, Figure 8b).
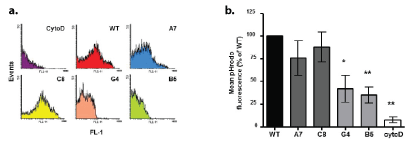
Figure 8: The effect of TREM2 KD/KO on phagocytosis.
a. Representative FACS histograms of BV2 phagocytosis of pHrodo green E.coli particles as a measure of phagocytosis. CytoD (cytochalasin-D) treatment was used as a negative control.
b. Mean pHrodo fluorescence of individual cells for each cell type expressed as a percentage of WT values. Values expressed as mean ± SEM for 6 individual experiments (*ρ<0.05, **ρ<0.01; one way ANOVA with Dunnett’s multiple comparison test).
Discussion
Here we have determined the consequences to microglia of KD and KO of the TREM2 gene. Microglia showed reduced or no expression of the protein when compared with WT cells, no secretion of sTREM2, and the subcellular colocalisation of TREM2 to the Golgi was significantly reduced or absent. In addition filopodial length was reduced and filopodial number increased in TREM2 KD/KO cells. Further analyses revealed reduced ruffle formation in response to ATP or MCSF stimulation with a concomitant reduction in the expression of Iba1. These effects were not due to a reduction in β-actin protein or mRNA expression, but could not be reversed by the addition of WT sTREM2. Whilst no obvious defect was observed in the ability of KD A7 and C8 clones to phagocytose E.coli, both KO clones G4 and B5 showed a significant reduction in phagocytosis compared with WT. Microglia are acutely responsive to changes in their microenvironment and upon activation can exhibit dramatic changes in their shape, together with movement and phagocytic properties. Membrane ruffles and filopodia are important for these processes [10- 12]. Such cellular responses are the result of dynamic remodelling of the actin cytoskeleton [13] and Rho family GTPases, Cdc42, Rac, and Rho, are known to be molecular switches that organise remodelling of the actin cytoskeleton [14]. Rac, in particular, has been shown to be involved in membrane ruffling in microglia [9] and defects in the ability of Rac signalling in the BV2 cells with TREM2 heterozygous and homozygous knockdown would explain the results found here for membrane ruffling and phagocytosis. Actin signalling is thought to be downstream of TREM2 activation [15]. Actin expression per se was not found to be reduced, thus excluding differential expression of actin as the cause for the variation found in actin-rich filopodia formation. F-actin has been shown to co-localise with Iba1 in membrane ruffles and Iba1 is important for the formation of ruffles [13,16] as well as phagocytosis [9]. We found that both mRNA and protein for Iba1 were significantly reduced in the KO and KD clones. The most extreme deficit in membrane ruffling was observed in the B5 KO clones but attempts to rescue this by the addition of WT cell supernatant containing sTREM2 was not effective, suggesting that plasma membrane trafficked receptor is needed for cytoskeletal signal engagement within the cells. The defects in the ability of the cells to phagocytose E. coli are in line with previous reports suggesting TREM2 plays a role in phagocytosis [17,18]. It will be important to determine whether phagocytosis of other particles such as apoptotic cells is also affected since activation of TREM2 results in phagocytosis of apoptotic neuronal debris [19]. We have recently shown that phagocytosis and migration are impaired in human induced pluripotent stem cell derived microglia expressing Nasu-Hakola variant of TREM2, indicating that cytoskeletal reorganisation is thus abnormal in NasuHakola microglia [20]; human cases of Nasu-Hakola show cytoskeletal changes [21]. Furthermore in mice lacking TREM2, and in humans with heterozygous TREM2 mutations, microglia express a reduced ability to envelop amyloid deposits as TREM2, which is normally enriched on microglial processes, is lacking or dysfunctional, again supporting our findings of process changes and cytoskeletal dysfunction linked with TREM2 mutations [22]. The processes of phagocytosis, namely engulfment, internalisation and degradation of particles, rely entirely upon the ability of the actin cytoskeleton to modify the structure of the plasma membrane [10]. Filopodia are implicated in the early steps of engulfment by dragging particles towards the cell and can extend 10 μm from the cell [23]. The particle engulfment then occurs within the phagocytic cup is mediated by Rac and Cdc42. The shortened filopodial lengths observed here for the KD/KO clones are therefore likely be linked with the reduced phagocytosis as the microglia are less able to identify, bind to and pull particles towards the cell body for effective phagocytosis. Since baseline surveillance mechanisms in microglia have been shown to be modulated by ambient ATP levels, TREM2 variants may show an alteration in their ability to respond to ATP. One reason for the differences in process formation may be the lack of ATP or of a reduction in ATP receptors as this has been shown to lead to shorter, slower finger-like processes. The gene edits in the KD and KO cell lines may be predicted to result in heterozygous and homozygous loss of function of the receptor, which aims to replicate the heterozygous mutations implicated in Alzheimer’s disease and the more severe homozygous loss of function mutations that cause Nasu-Hakola disease. Interestingly despite the detection of TREM2 by Western blot following deglycosylation, WT BV2 showed low surface expression of TREM2 but Golgi localised TREM2 by immunocytochemistry. Similar findings for other microglial lines have been reported with strong staining in the Golgi complex [24,25]. Taken together these data provide evidence of how TREM2 mutations may manifest to promote dysfunctional microglia in heterozygous disease (such as occurs in late-onset Alzheimer’s disease) and homozygous disease (such as Nasu-Hakola disease), both of which lead to dementia.
Methods
BV2 microglia culturing
All tissue culture solutions were of the highest tissue culture grade, of low endotoxin specifications and unless stated otherwise were obtained from Life Technologies. Cells were routinely checked for mycoplasma infection using PCR. Unless otherwise stated, all chemicals and reagents were obtained from Sigma Chemical Co, UK. The murine BV2 microglial cell line (BV2s) was used in all the studies conducted in this paper [23]. The parent BV2 line was obtained from Banca Biologica e Cell factory (Genova, Italy) and routinely plated and maintained in Roswell Park Memorial Institute (RPMI) 1640 Medium with 10% (v/v) heat inactivated foetal calf serum (FBS) and 100 U/ml penicillin, 100 µg /ml streptomycin at 37° C, 5% CO2. Cells were kept at low passage number and discarded after passage number 20.
Generation of TREM2+/- and TREM2-/- BV2 cell lines by CRISPR/Cas9n-mediated genome editing
CRISPR/cas9n gene editing technology was used to generate TREM2 knockout lines from the mouse BV2 microglial cell line. BV2 cells were transfected with CRISPR/Cas9n nickase plasmids targeting the second exon of the TREM2 gene (SC-429903-NIC; Santa Cruz Biotechnology Inc.) using the NucleofectorTM SFKit for 4DNucleofectorTM (Lonza) according to manufacturer’s recommendations. Selection of GFP positive clones and single cell sorting was carried out using a fluorescence activated cell sorter 48 hours post-transfection. Single cell clones were then cultured and expanded with RPMI complete medium for 2 weeks followed by screening for genetic modifications in TREM2 by PCR amplification and Sanger sequencing (Source Bioscience). PCR amplification for sequencing analysis was performed in a 25 μl reaction volume. PCR mix was composed of the following; 5 μl × 1 μM of each forward and reverse primers (Fw-sT2; ACCCAAGGACCAGAACTTATC, Rv-sT2; TCCCATTCCGCTTCTTCAG) 12.5 μl 2 × KAPA HiFi HotStart Ready Mix (KAPA Biosystems, Cat # KK2601) and 2.5 μl of gDNA (~12.5 ng). PCR was conducted in a Mastercycler benchtop thermocycler (Eppendorf, Germany). Cycling conditions were as follows: 3 min at 95ºC, followed by 35 cycles of amplification (30 sec at 95ºC, 30 sec at 62ºC and 30 sec at 72°C) and 5 min at 72°C. No full Knock-Out (KO, TREM2-/-) clones were obtained in the first round of CRISPR/ Cas9n modification. We obtained 6 cell clones with partial TREM2 KO (TREM2+/-1 allele KO and 1 WT allele); of those we selected two for further experimentation; clones BV2-A7 (4bp deletion) and BV2-C8 (34bp deletion). Confirmation of heterozygous mutations was done by single colony Sanger sequencing of PCR products. A second round of CRISPR/Cas9n modification was carried out using the previously modified clone BV2-C8. The second round of CRISPR/ Cas9n modification was performed as described for the lines above. Selection of clones was done by PCR amplification, enzyme restriction and Sanger sequencing. After selection, we obtained 3 clones with homozygous 23 bp deletions in TREM2, rendering these clones complete TREM2 KO (TREM2-/-). We only selected two for further experimentation; clones BV2-B5 and BV2-G4.
PCR amplification of exons 2 to 5 of the TREM2 gene from cDNA and sequencing
cDNA was synthesized from total RNA (0.5 µg) from each of the 5 cell lines studied, using the High-Capacity RNA-to-cDNA™ Kit (Life Technologies, Cat# 4387406) in a total volume of 20 μl as per manufacturer’s recommendations. cDNA products from all 5 cell lines were diluted 1:1000 in nuclease-free water. Subsequently, 2 μl from each dilution was amplified by PCR using primers designed to amplify exons 2 to 5 of the mouse TREM2 gene (amplicon size of 900bp for isoform 1 and/or 845bp for isoform 2). The amplification reaction was performed in a volume of 50 μl, which contained 2 × KAPA HiFi HotStart Ready Mix, 0.3 μM of each primer (Ex2_5 Forward primer: 5’- CTGTCCCAAGCCCTCAAC-3’ and Ex2_5 Reverse primer: 5’- ACAACCATCCAGCTGTCTTC-3’), and 2 μl of the 1:1000 cDNA dilution. A similar reaction was carried out using genomic DNA (50 ng) from each cell line as a negative control for the amplification. PCR cycling conditions were as follows; initial denaturation at 95°C for 3 min followed by 30 cycles with denaturation at 98°C for 20 sec, annealing at 65ºC for 15 sec, extension at 72ºC for 30 sec; then a final extension at 72°C for 1 min. PCR were subsequently visualized on a 1.5% agarose gel to verify the size of the amplicon. Finally, PCR products were purified using the QIA quick PCR Purification Kit (Qiagen, Cat# 28104) and then sequenced commercially (Source Bioscience, Nottingham, UK). Alignment of sequences and analysis was carried out using SnapGene software (GSL Biotech, version 3.3.3).
Quantitative Polymerase Chain Reaction (qPCR) for evaluation of mRNA expression levels
For qPCR analysis of mRNA expression levels, BV2 cells were cultured for 24 hours prior to treatment or sample collection and were lysed and homogenised using QIAzol buffer (QIAGEN, Hilden, Germany). Total RNA was extracted using miRNeasy mini kit (QIAGEN) with an additional on-column DNase digestion step using RNase-free DNase set. The concentration of total RNA extracted was determined using a Nanodrop spectrophotometer. Sample volumes equivalent to 500 ng RNA were used to generate complementary DNAs using the High-Capacity RNA-cDNA kit (Thermo Fisher Scientific), according to the manufacturer’s instructions. Quantitative PCR was conducted using TaqMan Universal Mastermix II (Thermo Fisher Scientific) in the Stratagene Mx3000p qPCR system and MxPro qPCR software. Expression probes were from Thermo Fisher Scientific and expression was normalised to gapdh.
Western blotting of TREM2 expression
Western blotting was performed using standard techniques. Cells were plated at a density of 8 × 10⁴ /well in 6 well plates. Cells were lysed in ice cold lysis buffer (1% NP-40, 150 mM NaCl, 50 mM TrisHCl (pH 7.2) plus Halt Protease and Phosphatase Inhibitor), and soluble protein (35 μg/well) was separated by SDS-PAGE (4-20% BIO-RAD mini-PROTEAN TGX Precast Gels). Proteins were transferred to nitrocellulose membrane and incubated with primary antibody (final concentrations: 1:500 sheep polyclonal anti-TREM2, R&D Systems #AF1729; 1:10000 mouse monoclonal anti-β-actin, Sigma #A5441, 1:1000 rabbit anti-Iba1, Wako #019-19741) followed by an appropriate fluorescently-conjugated secondary antibody respectively (1:60,000 Donkey Anti-Sheep Alexa Fluor 790 conjugate, Jackson Immuno Research #713-655-147; 1:15000 Goat anti-Mouse Alexa Fluor 680 conjugate, Life Technologies #A21058; 1:15000 Goat-anti rabbit Alexa Fluor 790 conjugate, Life Technologies #A11369). Membranes were visualised using the Odyssey infrared imaging system (Odyssey V3.0 Software) and the resulting bands were subjected to densitometry analysis using ImageJ software. Treatments and conditions were replicated 3 times and quantified for statistical analysis. In order to accurately quantify the highly glycosylated TREM2 protein, the equivalent volume of 35 µg protein was treated with peptide:Nglycosidase (PNGase, according to the manufacturer’s instructions) to induce sample deglycosylation. Samples were then prepared for gel electrophoresis as above.
Immunolocalisation of TREM2 in BV2 clones
Cells plated on 13 mm glass coverslips at a density of 5000 cells per coverslips were fixed in 4% paraformaldehyde (PFA) for 20 min, quenched with 50 mM ammonium chloride (NH4 Cl in PBS) for 10 min at RT, followed by permeabilisation with 0.2% Triton-X100 for 5 min at RT, then washed and blocked for 30 min at RT with appropriate blocking solution 5 % normal donkey serum for TREM2, 3% bovine serum albumin for all others. Primary antibodies prepared in block (final concentrations: 10 µg/ml sheep anti-TREM2, R&D Systems #AF172; 1:100 rabbit anti-Golgin 97, Cell Signalling Technology #13192; 1:50 mouse anti-Calnexin, Santa Cruz Biotechnology, #sc23954; 1:500 rabbit anti-Iba1, Wako# 019-19741) were incubated with the cells for 2 h at RT. Appropriate fluorescently conjugated secondary antibodies were incubated with the cells for 1 h, at RT. Coverslips were mounted on slides with Vectashield mounting medium containing 4′,6-diamidino-2-phenylindole (DAPI) for nuclear staining and images acquired on a Zeiss LSM710 confocal microscope. For golgin97 staining, methanol was used for fixation and permeabilisation instead of PFA and Triton-X100; cells were fixed and permeabilised in icecold methanol for 20 minutes at -20ºC. The coverslips were washed, blocked in BSA and the protocol continued as for PFA fixation.
ELISA assay for soluble TREM2 (sTREM2) shedding
BV2 cell lysates from the different clones were collected from cells plated at a density of 8 × 10⁴ cells/ well in a 24 well plate. Cell culture supernatants (SNs) were centrifuged briefly to pellet any floating cells or debris, and SN decanted to a second vial and snap frozen. SNs were thawed once only to reduce freeze-thaw deterioration. Quantification of soluble TREM2 (sTREM2) was performed using an in-house generated ELISA. MaxiSORP 96 well plates were coated overnight at 4ºC with 1 µg/ml rat anti-human/mouse TREM2 monoclonal antibody (R&D Systems; #MAB17291). Plates were washed 3 times with 0.1% PBS-T, blocked with 1% BSA in PBS for 45 min at RT followed by 3 more washes with 0.1% PBS-T. Recombinant murine TREM2-Fc (R&D Systems; #1729-T2-050) was used to prepare a standard curve to allow the concentration of sTREM2 in the samples to be determined. Cell culture supernatants and TREM2 standards were incubated for 2 h, at RT, followed by 3 washes. Then 0.2 µg/ml anti-mouse TREM2 biotinylated polyclonal antibody (R&D Systems; #BAF1729) was incubated on the plates for 2 h at RT, washed and then incubated with 0.1 µg/ml streptavidin-HRP for 45 min at RT. Following 3 washes with 0.1% PBS-T, a chromogenic substance (TMB, Invitrogen) was added to the plates. The reaction was terminated by the addition of 0.5M H2SO4 in H2O and absorbance was read at 450 nm (TecanGenios).
Cytoskeletal analysis of filopodial extension, number and membrane
To study the morphological phenotypes of BV2 microglia, phalloidin staining of F-actin was performed using Phalloidin CF568 and a standard protocol [27], according to the manufacturer’s instructions (Biotium). Cells were placed on 13mm glass coverslips at a density of 5000 cells per coverslip. Following treatment with murine macrophage colony-stimulating factor (MCSF, 100 ng/ ml) or adenosine triphosphate (ATP, 50 μM) in serum free RPMI for 5 min, cells were washed with PBS and fixed with 4% PFA in PBS for 20 min. Cells were permeabilised with 0.5% Triton-X100 (made up in PBS) at RT for 10 min, washed and incubated with a 1:40 dilution of fluorescent phalloidin at RT in the dark for 20 min. Coverslips were mounted on slides with Vectashield mounting medium plus DAPI counterstain. Images were acquired on a Zeiss LSM710 confocal microscope using Zeiss Zen Microscope software. Cytoskeletal analysis was carried out using ImageJ software (version 1.50). For analysis of filopodia formation, the samples (3 independent experiments, 40-50 cells per sample) underwent blinded measurement of filopodia length and quantification of filopodia number per cell. The samples (5 independent experiments, 40-50 cells per sample) underwent blinded morphological scoring for membrane ruffle formation as: absence, 0, ruffling response 1. Membrane ruffles were defined as wave-like regions of intense F-actin staining at extended cell edges. Immunohistochemistry was performed to confirm that regions counted as ruffles possessed F-actin and Iba1 colocalisation as reported in the literature [9].
Phagocytosis assay
Cells were plated at a density of 1 × 10⁵ per well in a 24 well plate for 24 h prior to the assay. As a negative control, cells were preincubated with 10 µM cytochalasin-D for 30 min, a potent inhibitor of actin polymerisation, which is vital for the changes in cell structure required for the phagocytosis of particles. Cells were incubated with 50 µg pHrodo green E. coli particles (Life Technologies) for 30 min at 37ºC, rinsed in PBS, and washed twice in ice cold FACS buffer (0.5% BSA, 0.05% sodium azide and 2 mM EDTA in PBS without CaCl2 or MgCl2). Cells were analysed with a BD FACS Calibur flow cytometer and results were analysed with flowing software (Cell Imaging Core of the Turku Centre for Biotechnology, flowingsoftware.btk.fi). Mean fluorescence intensities were calculated for each sample.
Statistical analyses
Results were analysed using Prism software (Version 7, Graph Pad). One-way ANOVA analysis with Dunnet’s correction for multiple comparisons was used unless otherwise indicated.
Acknowledgements
A. Phillips was supported by a PhD studentship from Complement UK/Alexion to J.M. Pocock, J Hardy and S Lovestone C Villegas-Llerena was supported by a studentship from the Peruvian Government, T M Piers was supported by funding to J M Pocock and J Hardy from funding received from the Innovative Medicines Initiative 2 Joint Undertaking under grant agreement No 115976. This Joint Undertaking receives support from the European Union’s Horizon 2020 research and innovation programme and EFPIA. K Cosker was supported by Eisai:UCL Therapeutic Innovation Group (TIG) funding to JM Pocock and J Hardy. We thank Dr Dimitra Schiza for assistance with the confocal imaging.
Contributions
JM Pocock conceived the initial project, the research was carried out by A. Phillips and C Villegas Llerena, TM Piers assisted with the running of the Western blot and the measurement of sTREM2 by ELISA, K Cosker carried out the ruffle analysis, JM Pocock wrote the paper with input from all authors. All authors read, commented upon and approved the final manuscript.
Competing Interests
The authors declare no competing interests.
Declarations
- Ethics approval and consent to participate: Not applicable
- Consent for publication: Not applicable
Availability of data and material: All data generated or analysed during this study are included in this published article.
