Introduction
The use of nanoparticles in diagnosis and therapy for cancer is
progressively growing, and may be one of the most important developments
in drug delivery systems. Liposomes are highly biocompatible and
biodegradable nanosized particles and can enclose hydrophilic drugs in
the inner aqueous cavity [1,2]. Liposome-based anticancer chemotherapy
has attracted much attention due to its advantage of reducing cytotoxicity
in healthy tissues by encapsulating drugs. Hence, several multi-functional
liposome formulations have been investigated with a view to clinical use
in recent years. For instance, polyethylene glycol (PEG)-coated longcirculating
liposomes encapsulating doxorubicin (DOX) have already
been approved in the clinical setting [3,4]. Yatvin et al. [5] developed
thermosensitive liposomes (TSLs) entrapping anticancer drugs for the
first time in 1978. TSLs are one of the most promising tools for cancer
therapy when used in combination with local hyperthermia. TSLs made
with 1, 2-dipalmitoyl-sn-glycero-3-phosphocholine (DPPC) are designed
to release encapsulated drugs at the melting phase transition temperature
of the lipid bilayer [1]. Recently, much effort has been put into the
development of new TSL formulations. In 2011, Tagami et al. [6,7] reported
a novel TSL formulation composing of DPPC and polyoxyethylene (20)
stearyl ether (Brij78®
) at a molar ratio of 96 : 4 (hyperthermia-activatedcytotoxic
(HaT)-liposome) and that the HaT-liposomes encapsulating
gadolinium-diethylenetriaminepentaacetic acid (Gd-DTPA) could be
used in hyperthermia combined with drug delivery under monitoring by
magnetic resonance imaging (MRI).
Hyperthermia is one approach to cancer therapy. However, there is a
technical difficulty in local heating to the hyperthermic condition without
damaging surrounding normal tissues [8,9]. Hyperthermia using magnetic
nanoparticles (MNPs) (magnetic hyperthermia: MH) has gained much
attention in recent years because it solves this problem. MNPs have been
widely used in nanomedicine for their high versatility. MNPs generate
heat when exposed to an alternating magnetic field (AMF) as a result
of magnetic hysteresis and/or relaxational losses (Brownian and Néel
relaxations) [10,11]; this results in heating of the tissue in which MNPs
have accumulated [12].
In addition, MNPs based on superparamagnetic iron oxide (maghemite
or magnetite) have been used as contrast agents for MRI. The use of these
agents enhances negative contrast on transverse relaxation time (T2*)-
weighted images due to shortening of T2*. Béalle et al. [13] prepared
magnetic liposomes named Ultra Magnetic Liposomes, which were
suitable for systemic delivery and characterized by an outstanding loading
potential of MNPs through the incorporation of a high amount of MNPs
in the aqueous core of the vesicle. The high encapsulation of MNPs into
liposomes allows for efficient MRI detection, magnetic targeting, and
heating of the sites of interest while minimizing the injected dose [13].
Recently, a new imaging method called magnetic particle imaging
(MPI) has been introduced [14]. MPI allows imaging of the spatial
distribution of MNPs with high sensitivity, spatial resolution, and imaging
speed [14]. MPI uses the nonlinear response of MNPs to detect their
presence in an AMF, which is referred to here as the drive magnetic field.
Spatial encoding is accomplished by saturating the MNPs over most of
the imaged region using a static magnetic field (selection magnetic field),
except in the vicinity of a special position called the field-free point [14] or
field-free line [15]. We have developed a system for MPI with a field-freeline
encoding scheme, in which the field-free line is generated using two
opposing neodymium magnets, and transverse images are reconstructed
from the third-harmonic signals received by a gradiometer coil using the
maximum likelihood-expectation maximization (ML-EM) algorithm
[16,17].
TSLs encapsulating both MNPs and anticancer drugs have the potential
to be applied not only for diagnosis using MPI as a contrast agent but also
to chemotherapy using the drug release induced by MH. The purpose of
this study was to develop TSLs encapsulating MNPs and calcein or DOX
and to investigate the feasibility of visualizing them using MPI in vitro and
in vivo and the therapeutic effect of chemotherapy using the DOX release
induced by MH in vivo.
Materials and Methods
Materials
DPPC and Brij78® were purchased from Wako Pure Chemical Industries,
Ltd. (Osaka, Japan). Bis [N,N-bis (carboxymethyl) aminomethyl]
fluorescein (calcein) was manufactured by Dojindo Co., Ltd. (Kumamoto,
Japan) and purchased from Wako Pure Chemical Industries, Ltd. (Osaka,
Japan). Potassium thiocyanate and ammonium sulphate were purchased
from Wako Pure Chemical Industries, Ltd. (Osaka, Japan). Magnetic fluid
M-300 (magnetite, Fe3
O4
) was purchased from Sigma Hi-Chemical Inc.
(Kanagawa, Japan). Phosphate buffered saline (PBS) (NaCl 137 mM, KCl
2.7 mM, Na2
HPO4
10 mM and KH2
PO4
2 mM, pH 7.4) was purchased from
Wako Pure Chemical Industries, Ltd. (Osaka, Japan). DOX hydrochloride
was purchased from Kyowa Hakko Kirin Co., Ltd. (Tokyo, Japan).
Preparation of TSLs encapsulating calcein: The TSLs encapsulating
calcein were prepared by thin film and hydration methods [18]. First,
20 mg/mL of a lipid mixture composed of DPPC and Brij78®
at a molar
ratio of 96:4 was dissolved in ethanol in a round-bottom flask. The solvent
was removed by a rotary evaporator and desiccated for 24 h. The lipid
mixture was hydrated at 65°C by adding a PBS solution of calcein (63
mM) with the pH adjusted to 7.4. The suspension obtained was sonicated
for 5 min, and the sonication was repeated four times with intervals of 1
min. Unencapsulated calcein was removed by gel chromatography using
Sepharose gel in a CL-2B column (2 cm in diameter and 50 cm in length)
(GE Healthcare Japan Co., Ltd., Tokyo, Japan) with a flow rate of 1 mL/
min, and PBS was used as the elution solution.
Measurement of calcein release: The calcein release from the calceinloaded
TSLs was measured using the self-quenching phenomenon of
calcein fluorescence [18]. Briefly, a 60 µL suspension of the liposome
solution containing calcein was added to 600 μL PBS in a micro tube. The
samples obtained from the suspension were incubated for 20 min at each
temperature starting at 27°C and increasing to 34, 36, 38, 40, 42, 44°C
using a block incubator (BI-516S, ASTEC Co., Ltd., Fukuoka, Japan).
Twenty µL of each sample was diluted by adding 2 mL of PBS, and the
sample was placed in a 96-well plate for the measurement of fluorescence
intensity. The fluorescence intensity was measured using a plate reader
(F-7000, Hitachi Co., Tokyo, Japan) at an excitation wavelength of 485 nm
and an emission wavelength of 520 nm. To measure the maximal release
of calcein, 60 μL of the suspension was added to 600 μL PBS containing
1% Triton X-100 (Wako Pure Chemical Industries, Ltd., Osaka, Japan) in
a weight ratio (6 μL) and incubated for 20 min at 50°C to destroy the
liposomal membrane. The percentage of the calcein release from the
calcein-loaded TSLs was calculated as in Equation 1:
$$Release\left( \% \right)\, = {{{F_a}\, - {F_b}} \over {{F_t}\, - {F_b}}}\, \times 100\,............\left( 1 \right)$$
Where Fb
and Fa
denote the fluorescence intensities of the liposome
suspension before incubation and after 20 min incubation at a given
temperature, respectively, and Ft
is the fluorescence intensity of the sample
treated by Triton X-100. The relationship between the temperature and
calcein release was fitted to a sigmoid function given by Equation 2 using
the non-linear least-squares method [19].
$$f\left( x \right)\, = {a \over {1\, + \,{e^{ - b\left( {x - c} \right)}}}}\, \times 100\,............\left( 2 \right)$$
Where a, b, and c are constants.
Preparation of TSLs loading DOX: The TSLs loading DOX were
prepared according to the procedure described above with some minor
modifications [6,7]. First, 20 mg/mL of the lipid mixture composed of
DPPC and Brij78® at a molar ratio of 96:4 was dissolved in ethanol in a
round-bottom flask. The solvent was removed by a rotary evaporator and
desiccated for 24 h. The lipid mixture was hydrated at 65°C by adding
280 mM ammonium sulphate (pH 4-4.5). The suspension obtained was
sonicated for 5 min, and the sonication was repeated four times with
intervals of 1 min. After the TSL solution was cooled to room temperature,
DOX was encapsulated into the TSLs by the pH gradient method [6,7];
the exterior solution of the liposome suspension was replaced by PBS
via dialysis for 3 h against three exchanges of 500 × volumes of PBS.
The liposome suspension and DOX were mixed at a DOX to lipid ratio
of 0.05 (w/w) and the mixture was incubated at 37°C for 90 min. The
unencapsulated DOX was removed by gel chromatography as described
above for calcein.
Measurement of DOX release: The DOX release was also measured
using the self-quenching phenomenon of DOX fluorescence [18]. In
brief, 200 µL suspension of the liposome solution containing DOX was
added to 200 µL PBS in a micro tube. The samples obtained from the
suspension were incubated for 20 min at each temperature starting at
27°C and increasing to 34, 36, 38, 40, 42, 44°C using a block incubator
(BI-516S, ASTEC Co., Ltd., Fukuoka, Japan), and then the sample was
placed in a 96-well plate for the measurement of fluorescence intensity.
The fluorescence intensity was measured using a plate reader (F-7000,
Hitachi Co., Tokyo, Japan) at an excitation wavelength of 485 nm and an
emission wavelength of 590 nm. The percentage of the DOX release from
the TSLs was calculated from Equation 1. The relationship between the
temperature and DOX release was also fitted using a sigmoid function as
described above.
Phantom experiments
System for MPI: The details of our MPI system are described in our
previous papers [16,17,20-23]. In brief, the field-free line was generated
by two opposing neodymium magnets. The drive magnetic field was
generated using an excitation coil (solenoid coil 100 mm in length, 80
mm in inner diameter, and 110 mm in outer diameter). AC power was
supplied to the excitation coil by a programmable power supply (EC1000S,
NF Co., Kanagawa, Japan), and was controlled using a sinusoidal wave
generated by a digital function generator (DF1906, NF Co., Kanagawa,
Japan). The frequency of the drive magnetic field was 400 Hz, and the
peak-to-peak strength of the drive magnetic field was 20 mT. The MNPgenerated
signal was detected by a gradiometer coil (50 mm in length,
35 mm in inner diameter, and 40 mm in outer diameter) and the thirdharmonic
signal was extracted using a preamplifier (T-AMP03HC, Turtle
Industry Co., Ibaragi, Japan) and a lock-in amplifier (LI5640, NF Co.,
Kanagawa, Japan). The output of the lock-in amplifier was converted to
digital data using a personal computer connected to a multifunction data
acquisition device with a universal serial bus port (USB-6212, National
Instruments Co., TX, USA). The sampling time was taken as 10 ms.
When measuring signals using the gradiometer coil, the sample was
placed 12.5 mm (i.e., one quarter of the coil length) from the center of the
gradiometer coil and the coil, including the sample, was moved such that
the center of the sample coincided with the position of the field-free line.
The selection magnetic field was generated by two opposing neodymium
magnets (Neomax Engineering Co., Gunma, Japan). The field-free
line can be generated at the center of the two neodymium magnets. To
acquire projection data for image reconstruction, both the sample and
the receiving coil were automatically rotated around the z-axis over
180° in steps of 5° and translated in the x-direction from −16 mm to 16
mm in steps of 1 mm, using an XYZ-axes rotary stage (HPS80-50X-M5,
Sigma Koki Co., Tokyo, Japan), which was controlled using Lab VIEW
(National Instruments Co., TX, USA). Data acquisition took about 12
min. Each projection data set was then transformed into 64 bins by linear
interpolation. Both the inhomogeneous sensitivity of the receiving coil
and feed through interference were corrected using the method described
in [23]. Transverse images were reconstructed from the projection data
using the ML-EM algorithm over 15 iterations, in which the initial
concentration of MNPs was assumed to be uniform [16,17].
System for MH: The details of our apparatus for MH are described in
our previous papers [21,24]. In brief, an AMF was generated with use of an
external coil comprising 19-turned loops (6.5 cm in diameter and 10 cm
in length) of copper pipe (5 mm in diameter). This was cooled by water to
ensure a constant temperature and impedance. The coil was connected to
a power supply (T162-5723BHE, Thamway Co., Shizuoka, Japan) through
an impedance tuner (T020-5723AHE, Thamway Co., Shizuoka, Japan).
This system induced an AMF with maximum peak amplitude of 3.7 kA/m
at an output power of 500 W. The amplitude of the AMF can be controlled
by changing the output of the power supply. In this study, the frequency and
peak amplitude of the AMF were taken as 600 kHz and 3.5 kA/m, respectively.
Preparation of TSLs encapsulating MNPs and calcein: First, 20 mg of
the lipid mixture composed of DPPC and Brij78® at a molar ratio of 96:4
was dissolved in ethanol at room temperature. The solvent was removed
by a rotating evaporator until a thin film formed in a round-bottom flask,
after which it was dried for 24 h. The thin film was hydrated at 65°C
with a PBS solution of M-300 with iron concentrations ranging from
43.8 mg/mL to 70.2 mg/mL and calcein solution (10 mM). The solution
was sonicated for 5 min, and the sonication was repeated four times at
an interval of 1 min. To remove the unencapsulated calcein, dialysis
was carried out seven times against isotonic NaCl solution for 2 h. The
unencapsulated MNPs were removed by washing with PBS and filtration
through a 0.1 μm Amicon low-binding Durapore® PVDF membrane
(Ultrafree, Millipore Co., MA, USA) using centrifugation at 2000 rpm for
15 min. These procedures were repeated three times. Finally, the aqueous
solutions above and below the filter were collected. We refer to the TSLs
encapsulating MNPs as “magnetic TSLs”. We also refer to the aqueous
solutions above and below the filter as “calcein-loaded magnetic TSL
solution” and “aqueous solution outside the TSLs”, respectively.
MPI of TSLs encapsulating MNPs and calcein: The calcein-loaded
magnetic TSL solution and the aqueous solution outside the TSLs
described above were put into separate cylindrical polyethylene tubes
(6 mm in diameter, 5 mm in length, and 100 μL in volume) and were
imaged using our MPI scanner as described above. After the MPI studies,
we drew a circular region of interest (ROI) with the same area as the crosssectional
area of the polyethylene tube (115 pixels) on the MPI image and
calculated the average MPI value within the ROI. In this study, the MPI
value was defined as the pixel value of the transverse image reconstructed
from the third-harmonic signals [16,17].
Measurement of net iron concentration in magnetic TSLs: The
net iron concentration in the magnetic TSLs was determined using the
potassium thiocyanate method according to the procedure published by
Frascione et al. [25]. First, aliquots of 20 µL of the liposome solution were
mixed with 5 μL of 1% Triton X-100 to break the liposomal membrane
and to release the MNPs. Concentrated HCl (37%) with a volume of 0.225
mL was then added to the samples to ionize the iron oxide crystal core
and to liberate the iron in its ferric state. The samples were incubated for
a few minutes with 0.250 mL of a 40 mM potassium thiocyanate solution.
The absorbance at a wavelength of 480 nm was read using a microplate
absorbance spectrophotometer (xMarkTM, Bio-Rad Laboratories Inc., CA,
USA). An aqueous solution of Fe3
O4
was used to record calibration curve.
Measurement of temperature rise and calcein release induced by
MH: We also heated the calcein-loaded magnetic TSL solution (1 mL in
total volume) for 30 min using our system for MH [21,24] at an AMF
frequency of 600 kHz and a peak amplitude of 3.5 kA/m, and measured
the time course of the temperature rise (ΔT(t)) using a fluorescence-type
optical-fiber thermometer (FL-2000, Anritsu Meter Co., Tokyo, Japan)
every 1 min for 30 min after the start of MH. Then, ΔT(t) was fitted to the
phenomenological Box-Lucas equation given by Equation 3 [26],
$$\Delta T\,\left( t \right)\, = \,T\,\left( t \right)\, - \,T\left( 0 \right)\, = \,A \times \left( {1\, - e{\,^{ - Bt}}} \right)\,\,............\left( 3 \right)$$
Where T(t) and T(0) are the temperatures at time t and 0, respectively,
and A and B are constants. This equation is often used to describe the
heating of MNPs using an AMF [16]. The product of the fitting parameters,
A × B, is equivalent to the initial slope of the time-dependent temperature
rise (ΔT/Δt)0, i.e., Equation 4
$${\left( {\Delta T\,/\,\Delta t} \right)_0}\, = \,A \times \,B\,\,............\left( 4 \right)$$
We investigated the correlations of the average MPI value, the
temperature rise, and (ΔT/Δt)0
with the net iron concentration of the
calcein-loaded magnetic TSLs.
After heating the calcein-loaded magnetic TSL solution, we measured
the calcein release using the dialysis method instead of using the selfquenching
phenomenon and gel chromatography. For the measurement,
the solution was dialyzed against isotonic NaCl solution for 2 h. A sample
of the dialysis external solution was placed in a 96-well plate and the
fluorescence intensity was measured using a plate reader at an excitation
wavelength of 485 nm and an emission wavelength of 520 nm. To measure
the maximum release of calcein, the sample was incubated at 50°C for
20 min using a block incubator (BI-516S, ASTEC Co., Ltd., Fukuoka,
Japan). Note that the incubation temperature of 50°C was determined
from the results of the calcein release measurement. The percentage of
the calcein release from the calcein-loaded magnetic TSLs was calculated
from Equation 5
$$Release\left( \% \right)\, = \,{{{F_{AMF}}\, - {F_b}} \over {{F_{50}}\, - \,{F_b}}}\, \times \,100\,............\left( 5 \right)$$
Where Fb
and FAMF denote the fluorescence intensities of the TSL
solution without and with exposure to AMF, respectively, and F50 is
the fluorescence intensity of the sample incubated at 50°C for 20 min.
The relationships between the temperature rise and calcein release and
between the average MPI value and calcein release were fitted using a
sigmoid function as previously described.
Animal experiments
Preparation of TSLs loading MNPs and DOX: The DOX-loaded
magnetic TSLs were prepared according to the procedure described
previously with some minor modifications [6,7]. After the thin film of
the lipid mixture composed of DPPC and Brij78® was prepared, it was
hydrated at 65°C by adding 280 mM ammonium sulphate (pH 4-4.5) and
M-300 with an iron concentration of 70.2 mg/mL. After the suspension
was sonicated and cooled to room temperature, DOX was encapsulated
into the suspension by the pH gradient method [6,7] as previously
described. In this case, the suspension and DOX were mixed at a DOX to
lipid ratio of 0.2 (w/w). To remove the unencapsulated DOX, the solution
was dialyzed against isotonic NaCl solution for 2 h. The unencapsulated
MNPs were removed by washing with PBS and filtration through a 0.1 µm
Amicon low-binding Durapore® PVDF membrane (Ultrafree, Millipore
Co., MA, USA) using centrifugation at 2000 rpm for 15 min. These
procedures were repeated three times.
Animals: All animal experiments were approved by the animal ethics
committee at the Osaka University School of Medicine. Seven-week-old
male BALB/c mice were purchased from Charles River Laboratories Japan,
Inc. (Kanagawa, Japan), and were habituated to the rearing environment
for one week before the experiment. The animals had free access to food
and water, and were kept under standard laboratory conditions of 22-
23°C room temperature, around 50% humidity, and a 12:12 hour light/
dark cycle. After one-week habituation, Colon-26 cells (1 × 10⁶
cells) were
implanted subcutaneously into the back of each mouse under anesthesia
by pentobarbital sodium (Somnopentyl, Kyoritsu Seiyaku Co., Tokyo,
Japan) (0.012 mL/g body weight).
Tumor volumes in all mice were measured with a caliper every day. The
tumor volume (V in mm3
) was calculated as Equation 6.
$$V\, = \,\left( {\pi \,/6} \right) \times \,{L_x} \times {L_y} \times {L_z}\,............\left( 6 \right)$$
Where Lx
, Ly
, and Lz denote the vertical diameter, the horizontal
diameter, and the height in mm, respectively. The relative tumor volume
growth (RTVG) was calculated by Equation 7.
$$RTVG\, = \,{{V - {V_0}} \over {{V_0}}}\,............\left( 7 \right)$$
Where V0 represents the tumor volume immediately before MH. In this
study, the RTVG value after MH was used as an index of the therapeutic
effect of MH.
Experimental procedure
When the tumor volume reached approximately 100 mm3
, mice were
divided into 4 groups (A, B, C, and D).The mice in Group A were injected
with saline directly into the tumor as a control (n=10); the mice in Group
B were injected with DOX-loaded magnetic TSLs directly into the tumor
and did not undergo MH (n=7); the mice in Group C were injected with
magnetic TSLs directly into the tumor and then underwent MH (n=7);
and the mice in Group D were injected with DOX-loaded magnetic TSLs
directly into the tumor and then underwent MH (n=7). In Groups B
and D, the DOX-loaded magnetic TSLs were injected at a dose of 5 mg
DOX/kg directly into the tumor under anesthesia. Ten minutes after the
injection of the DOX-loaded magnetic TSLs, MPI images were obtained
in the same manner as in the phantom experiments. In this study, one
slice of the MPI image with the maximum signal intensity was obtained
per mouse. After the MPI studies, X-ray CT images were obtained using
a 4-row multi-slice CT scanner (Asteion, Toshiba Medical Systems Co.,
Tochigi, Japan) with a tube voltage of 120 kV and a tube current of 210
mA. The MPI image was co-registered with the X-ray CT image using
parameters for magnification and rotation that were previously obtained
using a phantom with 3 point sources of diameter 0.5 mm and filled with
100 mM Fe MNPs. In Groups C and D, thirty minutes after the injection
of magnetic TSLs or DOX-loaded magnetic TSLs, MH was performed by
applying an AMF at 600 kHz and 3.5 kA/m for 20 min. The temperature
at the surface of the tumor was measured using an infrared thermometer
(FLIR E4, FLIR Systems Inc., OR, USA) immediately before and after MH.
Statistical analysis
In phantom experiments, we calculated the average MPI value within
a region of interest (ROI) with a diameter of 6 mm, drawn on the MPI
image. The correlations of the net iron concentration in the magnetic
TSLs with the average MPI value, temperature rise, and (ΔT/Δt)0
were
analyzed using linear regression analysis and the correlation coefficients
and regression equations were calculated. The correlation between the
average MPI value and (ΔT/Δt)0 was also analyzed using linear regression
analysis, whereas the correlation between the average MPI value and the
temperature rise was analyzed using the phenomenological Box-Lucas
equation [26] described previously.
In animal experiments, we calculated the average MPI value within the
ROI drawn on the tumor by taking the threshold value for extracting the
contour of the tumor as 40% of the maximum MPI value in the ROI. The
correlation between the average MPI value and the temperature rise was
analyzed using the phenomenological Box-Lucas equation [26] as in the
phantom experiments.
Unless specifically stated, the average MPI value, temperature rise,
tumor volume, and RTVG value were expressed as the mean ± standard
error (SE). For comparison of the RTVG value among groups, one-way
analysis of variance (ANOVA) was used. Statistical significance was
determined by the Tukey-Kramer multiple comparisons test. A P value
less than 0.05 was considered statistically significant. All analyses were
performed using Excel 2010 (Microsoft Co., WA, USA).
Results
Temperature-dependent release of calcein and DOX from TSLs
To investigate the thermo sensitivity of TSLs, the temperaturedependent
calcein and DOX releases from the TSLs were measured
after 20 min of incubation. Figure 1a shows the relationship between the
temperature and the percentage of calcein release from TSLs calculated
from Equation (1), whereas Figure 1b shows the case of DOX. The calcein
release from the TSLs steeply increased at about 38-40°C and plateaued
thereafter, whereas it was almost zero at 27-36°C (Figure 1a). The
temperature dependency of the DOX release was similar to that of the
calcein release (Figure 1b).
Phantom experiments
Figure 2a illustrates a phantom having two cylindrical polyethylene
tubes (6 mm in diameter, 5 mm in length, and 100 μL in volume) filled
with aqueous solution outside TSLs (left) and the TSL solution including
MNPs and calcein (right). Figures 2b-2f show examples of the MPI
images of the phantom when the net iron concentration determined by
the potassium thiocyanate method in the calcein-loaded magnetic TSLs
was 3.9 mg/mL (b), 5.8 mg/mL (c), 6.8 mg/mL (d), 9.5 mg/mL (e), and
12.0 mg/mL (f), respectively. As shown in Figure 2, the MPI pixel value
in the left tube was almost zero in all cases, whereas that in the right tube
increased with increasing iron concentration.
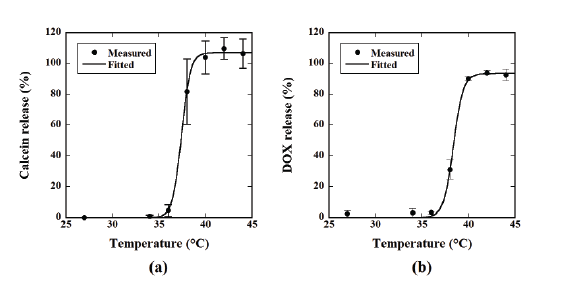
Figure 1: (a) Relationship between temperature and the percentage of the calcein release from thermosensitive liposomes (TSLs) calculated from
Equation 1. (b) Relationship between temperature and the percentage of the doxorubicin (DOX) release from TSLs calculated from Equation 1. Data
are represented by mean ± standard error (SE) for n=3.
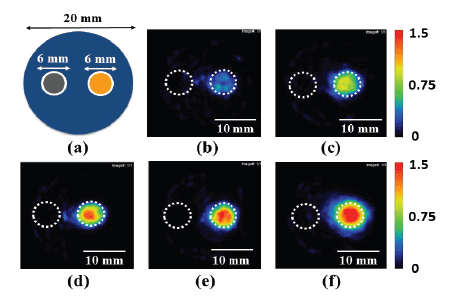
Figure 2: Illustration of a phantom having two cylindrical polyethylene tubes (6 mm in diameter, 5 mm in length, and 100 µL in volume) filled with
the aqueous solutions below (aqueous solution outside the TSLs) (left) and above the filter used for removing the unencapsulated MNPs (calceinloaded
magnetic TSL solution) (right) (a) and examples of MPI images of the phantom when the net iron concentration determined by the potassium
thiocyanate method in the magnetic TSLs was 3.9 mg/mL (b), 5.8 mg/mL (c), 6.8 mg/mL (d), 9.5 mg/mL (e), and 12.0 mg/mL (f).
Note: The dotted circles in (b)-(f) illustrate the polyethylene tubes. Scale bar =10 mm.
Figure 3 shows the time courses of the temperature rise in the calceinloaded
magnetic TSL solution, measured by a fluorescence-type optical-
fiber thermometer. The symbols ○, ●, Δ, ▲, and □ show cases when the
net iron concentration in the magnetic TSLs was 3.4 ± 1.0 mg/mL (mean
± standard deviation (SD) for n=4), 4.8 ± 2.8 mg/mL, 7.5 ± 3.1 mg/mL, 8.9
± 1.8 mg/mL, and 11.5 ± 1.6 mg/mL, respectively. As shown in Figure 3,
the temperature rise increased with increasing iron concentration.
Figures 4a-4c show the relationships between the net iron concentration
in the calcein-loaded magnetic TSLs and the average MPI value, between
the net iron concentration and the temperature rise, and between the
net iron concentration and (ΔT/Δt)0
, respectively. As shown in Figure
4, there were significant correlations in all cases and the correlation
coefficient between the net iron concentration and (ΔT/Δt)0
was the
highest (r=0.944).
Figure 5a shows the relationship between the average MPI value and
the temperature rise, whereas Figure 5b shows that between the average
MPI value and (ΔT/Δt)0
. It should be noted that when analyzing the
correlation between the average MPI value and the temperature rise, the
phenomenological Box-Lucas equation [26] described previously was
used, whereas the correlation between the average MPI value and (ΔT/Δt)0
was analyzed using a linear regression equation. As shown in Figure 5, the
average MPI value showed significant correlations with the temperature
rise (r=0.915) and (ΔT/Δt)0
(r = 0.923).
Figure 6a shows the relationship between the temperature rise and
the percentage of calcein release from the calcein-loaded magnetic TSLs
calculated from Equation 5, whereas Figure 6b shows that between the
average MPI value and the percentage of calcein release. The calcein
release from the calcein-loaded magnetic TSLs fitted well to a sigmoid
function and changed steeply with increasing temperature rise and
average MPI value.
Figure 3: Time courses of the temperature rise in magnetic TSLs solution, measured by a fluorescence-type optical-fiber thermometer. The symbols ○,
●, Δ, ▲, and □ show cases when the net iron concentration in the magnetic TSLs was 3.4 ± 1.0 mg/mL (mean ± standard deviation for n=4), 4.8 ± 2.8
mg/mL, 7.5 ± 3.1 mg/mL, 8.9 ± 1.8 mg/mL, and 11.5 ± 1.6 mg/mL, respectively. Data are represented by mean ± SE for n=4.
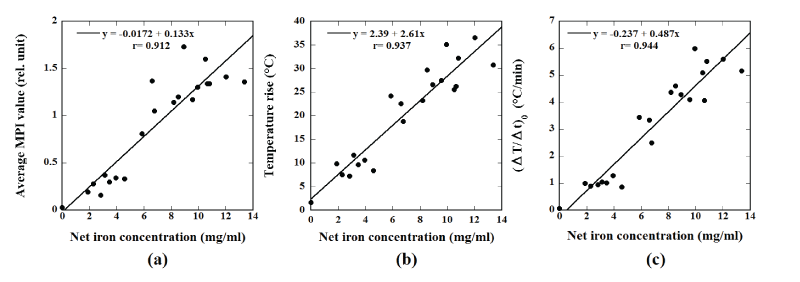
Figure 4: (a) Relationship between the net iron concentration in the magnetic TSLs and the average MPI value. (b) Relationship between the net iron
concentration in the magnetic TSLs and the temperature rise. (c) Relationship between the net iron concentration in the magnetic TSLs and the initial
slope of the time-dependent temperature rise (ΔT/Δt)0
.
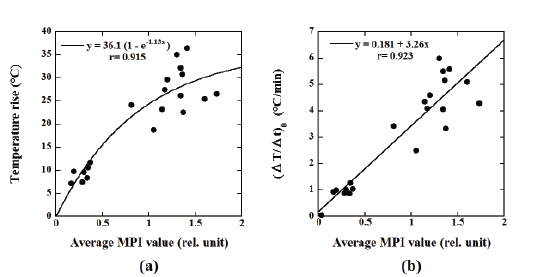
Figure 5: (a) Relationship between the average MPI value and the temperature rise. (b) Relationship between the average MPI value and (ΔT/Δt)0
.
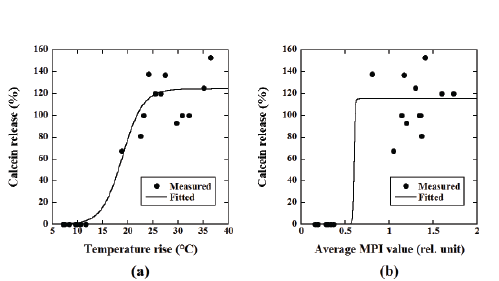
Figure 6: (a) Relationship between the temperature rise and the percentage of calcein release from the magnetic TSLs. (b) Relationship between
the average MPI value and calcein release.
Note that the solid line represents the fitted curve using a sigmoid function.
Animal Experiments
Figure 7 shows typical examples of MPI images of tumor-bearing mice
injected with the DOX-loaded magnetic TSLs with an iron concentration
of 12.0 mg/mL and a volume of 500 μL, which was superimposed on the
X-ray CT image. As shown in Figure 7, the distribution of MNPs obtained
by MPI correlated well with that of the tumor in the X-ray CT image in
both cases.
Figures 8a and 8b show the thermal images of a tumor-bearing
mouse injected with the DOX-loaded magnetic TSLs obtained by an
infrared thermometer immediately before and 20 min after the start of
MH, respectively. The temperature at the surface of the tumor increased
from 30.9 ± 2.8 to 41.6 ± 3.4°C (mean ± SD) 20 min after the start of
MH, whereas that of other regions did not rise significantly. The highest
temperature ranged from approximately 38 to 47°C and it lasted for at
least approximately 10 min.
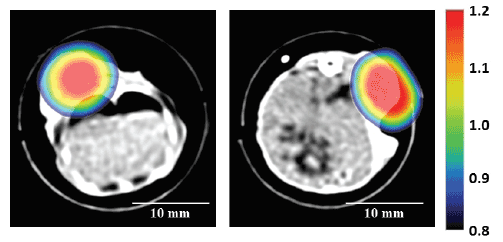
Figure 7: Typical example of MPI images of the tumor-bearing mice injected with DOX-loaded magnetic TSLs with an iron concentration of 12.0 mg/
mL and a volume of 500 µL, which was superimposed on the X-ray CT image. Scale bar=10 mm.
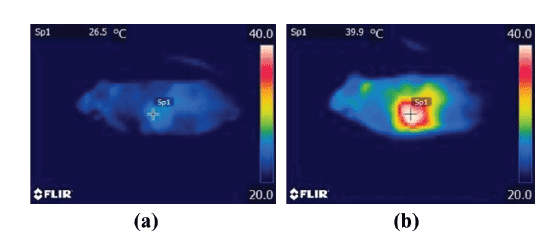
Figure 8: Thermal images of a tumor-bearing mouse injected with DOX-loaded magnetic TSLs obtained by an infrared thermometer immediately
before (a) and 20 min after the start of MH (b). Note that the lowest and highest levels for display were set at 20°C and 40°C, respectively.
Figure 9 shows the relationship between the average MPI value and
the temperature rise at the surface of the tumor injected with the DOXloaded
magnetic TSLs (●) and the magnetic TSLs without DOX (○)
measured by an infrared thermometer 20 min after the start of MH. There
was a significant correlation between them when performing regression
analysis using the phenomenological Box-Lucas equation [26] (r=0.690).
Figure 10 shows the time courses of the RTVG value in Groups A (□), B
(○), C (■), and D (●). There were significant differences between Groups
A and B 2 to 5 days after the injection of agents. There were also significant
differences between Groups A and C 3 days and 5 to 7 days after the
injection of agents. There were significant differences between Groups A
and D and between Groups C and D 1 day or more after the injection
of agents. There were no significant differences between Groups B and C
throughout the study period. There were significant differences between
Groups B and D 2 to 9 days and 11 days or more after the injection of agents.
Discussion
In the present study, we developed calcein- and DOX-loaded magnetic
TSLs and investigated the feasibility of visualizing them using MPI in vitro
and in vivo and the therapeutic effect of chemotherapy using the DOX
release induced by MH in vivo. Our results (Figures 1-10) demonstrated
that our magnetic TSLs can be applied to MPI and MH as nanocarriers.
Liposomes have the remarkable ability to carry drugs to a desired targeted
site and of reducing drug toxicity by encapsulating the drugs. TSLs are
one of the most attractive nanocarriers for cancer therapy when combined
with local hyperthermia, because they can release encapsulated drugs
under the hyperthermic condition (40-42°C) through the disruption of
liposomal membranes by moderately elevating the temperature [1,6]. For this
reason, many attempts to combine TSLs and local hyperthermia have been
conducted and their effectiveness has been studied using tumor-bearing mice
[27,28]. Some clinical trials have also been performed using TSLs comprising
DPPC and DOX (ThermoDox®
, Celsion Co., NJ, USA) [29,30].
MNPs can be used as a heating source upon stimulation by AMF. Tai et
al. [31] developed magnetic TSLs encapsulating dextran-coated iron oxide
nanoparticles (Resovist®
) and carboxylfluorescein, and demonstrated
the drug release induced by MH [31]. Although they used Resovist®
as a
source of MNPs, we used magnetic fluid (M-300) in this study due to its
availability. MNPs can be used as contrast agents for MRI and thus the
liposomes encapsulating MNPs can be visualized using MRI [13]. When
using a conventional T2*-weighted imaging sequence, however, the image
contrast decreases (negative contrast) due to a susceptibility-induced MR
signal loss. Currently, MPI has gained much attention as another imaging
method for MNPs. MPI can image the spatial distribution of MNPs in
positive contrast [20-22]. If we could develop TSLs encapsulating both
MNPs and anticancer drugs, we may expect that diagnosis using MPI and
therapy using the drug release induced by MH can be integrated.
As shown in Figure 1a, the calcein release from our calcein-loaded
TSLs after 20 min incubation steeply increased at about 38-40°C and
plateaued thereafter, whereas there was no significant release at around
body temperature (36°C). Our calcein-loaded TSLs eventually released
approximately 100% calcein at 42°C. Tagami et al. [6,7] have developed
HaT-liposomes composed of DPPC and Brij78® at a molar ratio of 96:4.
The HaT-liposomes have an optimum formulation for contrast-enhanced
MRI using Gd-DTPA and for drug release accompanied by hyperthermia.
Tagami et al. [6,7] reported that the HaT-liposomes showed more drug
release at 40-42°C than the low temperature-sensitive liposome (LTSL)
formulation, and showed blood pharmacokinetics similar to that of
the LTSL formulation. As shown in Figure 1b, our DOX-loaded TSLs
exhibited approximately 100% DOX release at 42°C after 20 min
incubation and no significant DOX release at lower temperature
(27-36°C). This temperature-dependent DOX release from our
DOX-loaded TSLs was similar to that of the calcein release from our
calcein-loaded TSLs (Figure 1a). As previously described, DOX was
encapsulated into the TSLs using the pH gradient method [6,7] in this
study. The above findings suggest that the pH gradient method is effective
for encapsulating DOX into the TSLs.
The magnetic TSLs developed in this study could be successfully
visualized by our MPI scanner in positive contrast (Figure 2). To the best
of our knowledge, this is the first report to show that magnetic TSLs can be
visualized using MPI. We previously reported that the average MPI value
has an excellent linear correlation with the iron concentration of MNPs
[20]. Therefore, the fact that the MPI value of the left tube in the phantom
shown in Figure 2 was much lower than that of the right tube appears to
demonstrate that almost all the unencapsulated MNPs were removed by
repeated washing with PBS and filtration using centrifugation.
We could observe the temperature rise induced by MH in our magnetic
TSLs both in vitro (Figure 3) and in vivo (Figure 8). Furthermore, the
temperature rise became higher with increasing iron concentration (Figure
4), indicating that MNPs were successfully encapsulated into the TSLs in a
concentration-dependent manner. As previously described, we quantified
the net iron concentration in the magnetic TSLs using the potassium
thiocyanate method and the net iron concentration thus obtained
had significant correlations with the average MPI value (r=0.912), the
temperature rise (r=0.937), and (ΔT/Δt)0
(r=0.944) (Figure 4). Note that
(ΔT/Δt)0
was obtained by fitting the time course of the temperature rise
(Figure 3) to the phenomenological Box-Lucas equation [26]. As shown in
Figure 5, the average MPI value also had significant correlations with the
temperature rise (r=0.915) and (ΔT/Δt)0
(r=0.923). These results suggest
that it is possible to control the temperature rise induced by MH by
changing the iron concentration of MNPs encapsulated in the magnetic
TSLs, which will be useful for reducing the side effects and unwanted
damage to surrounding healthy tissues in MH. These results also suggest
that our MPI scanner can estimate the iron concentration in the magnetic
TSLs using the average MPI value and predict the temperature rise that
will be induced by MH.
As previously described, when measuring the calcein release from
our magnetic TSLs in phantom experiments, the unencapsulated
calcein and unencapsulated MNPs were removed by repetitive dialysis
and by repetitive washing with PBS and filtration using centrifugation,
respectively, instead of using gel chromatography. This is mainly because if
we used gel chromatography for removing the unencapsulated calcein and
MNPs, the concentration of the magnetic TSLs was considerably diluted
and thus our MPI scanner could not detect the magnetic TSLs. As shown
in Figure 6a, the relationship between the calcein release induced by MH
and the temperature rise fitted well to a sigmoid function, as in Figure
1a. Although the relationship between the calcein release and the average
MPI value also fitted a sigmoid function, the scatter of the data was large
(Figure 6b). This large scattering of the data may be due to the fact that
the reproducibility of the above repetitive dialysis and/or washing and
filtration is low. As shown in Figure 6b, the calcein release induced by MH
increased steeply like a step function with increasing average MPI value,
suggesting that the average MPI value can be used to predict the threshold
in drug release from the magnetic TSLs induced by MH.
Finally, we performed animal experiments to investigate the feasibility
of the practical application of our magnetic TSLs. We prepared tumorbearing
mice by inoculating murine Colon-26 cells subcutaneously into
the backs of mice. As shown in Figure 7, our MPI scanner could visualize
the spatial distribution of the DOX-loaded magnetic TSLs in the tumor
in positive contrast. This excellent visibility of MPI will be useful for
the diagnosis of cancer. When combined with MPI, our DOX-loaded
magnetic TSLs will also provide useful information about the location of
the tumors. As shown in Figure 9, the average MPI value had a significant
correlation with the temperature rise (r=0.690) when analyzed using the
phenomenological Box-Lucas equation [26], suggesting that our MPI
scanner can predict the temperature rise in the tumor induced by MH.
This will be useful for monitoring and predicting the therapeutic response
to chemotherapy using the drug release induced by MH.
When the DOX-loaded magnetic TSLs were injected into the tumor
and MH was applied (Group D), the RTVG value was significantly lower
than that in the case when saline was injected into the tumor and MH
was not applied (Group A) (Figure 10), indicating that the combination
of our DOX-loaded magnetic TSLs and MH is useful for cancer therapy.
The RTVG value in Group D was also significantly lower than that in the
case when the DOX-loaded magnetic TSLs were injected and MH was not
applied (Group B) 2 to 9 days and 11 days or more after the injection of the
DOX-loaded magnetic TSLs. This result appears to indicate the therapeutic
effect of the DOX released from the DOX-loaded magnetic TSLs induced
by MH. However, there was a tendency for the RTVG value in group B to
be lower than that in Group A (there were significant differences between
them 2 to 5 days after the injection of the DOX-loaded magnetic TSLs or
saline). This may be due to the fact that there was some leakage of DOX
from the DOX-loaded TSLs at body temperature. As previously described,
the molar ratio of DPPC and Brij78® for preparing the TSLs was taken to
be 96:4 in this study. It would be possible to reduce the above leakage by
changing the molar ratio of DPPC and Brij78®. These studies are currently
in progress.
A limitation of this study is that the DOX-loaded magnetic TSLs were
injected directly into the tumor in order to accumulate as many MNPs
and DOX in tumors as possible. If the DOX-loaded magnetic TSLs were
adsorbed only to tumors, they could be administered intravenously. This
feature will be highly important when considering practical applications.
However, because the administered magnetic TSLs migrate passively to
mononuclear phagocyte systems such as the Kupffer cells of the liver and
spleen, passive targeting is a very important issue for the establishment of
cancer therapy. Shido et al. [32] and Motoyama et al. [33] have developed
magnetite cationic liposomes (MCLs) for improving absorption and
accumulation properties within tumors, because MCLs have a positive
electric charge at the liposomal surface. Administration of the MCLs,
however, is limited to direct injection into the tumor at present [34]. The
conjugation of antibodies to liposomal membranes may be a possible
approach for active targeting of tumors with magnetic TSLs. Thus, we
will develop antibody-conjugated magnetic TSLs having tumor-specific
targeting ability in the future.
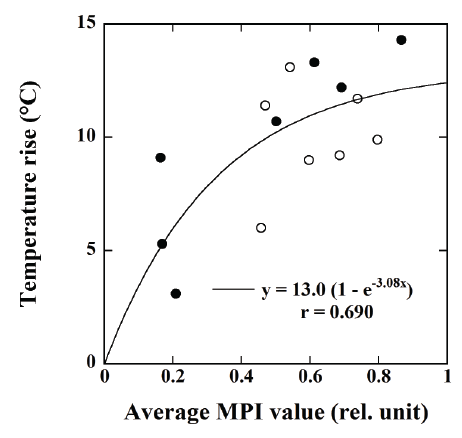
Figure 9: Relationship between the average MPI value and the
temperature rise at the surface of the tumor injected with the DOXloaded
magnetic TSLs (●) and the magnetic TSLs (○) measured by an
infrared thermometer 20 min after the start of MH.
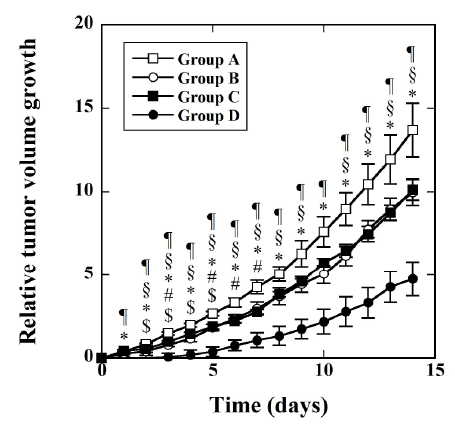
Figure 10: Time courses of the relative tumor volume growth (RTVG)
in Groups A, B, C, and D. RTVG is defined as (V-V0
)/V0
with V0
and
V being the tumor volumes immediately before and after injection of
agents, respectively. The mice in Group A (□) were injected with saline
directly into the tumor as controls (n=10); the mice in Group B (○) were
injected with DOX-loaded magnetic TSLs directly into the tumor and
did not undergo MH (n=7); the mice in Group C (■) were injected with
magnetic TSLs directly into the tumor and then underwent MH (n=7);
and the mice in Group D (●) were injected with DOX-loaded magnetic
TSLs directly into the tumor and then underwent MH (n=7). Data are
represented by mean ± SE. $: p<0.05 between Groups A and B, #:
p<0.05 between Groups A and C, *: p<0.05 between Groups A and D, §:
p<0.05 between Groups B and D, and ¶ : p<0.05 between Groups C and D.
Conclusion
We developed the calcein- and DOX-loaded magnetic TSLs and could
visualize them using MPI both in vitro and in vivo. Our results suggest
that they are useful as drug delivery nanocarriers in nanomedicine. Our
results also suggest that MPI is useful for enhancing the therapeutic effect
of the chemotherapy using the drug release from the magnetic TSLs
encapsulating anticancer drugs, because MPI can visualize the magnetic
TSLs in positive contrast and allows us to quantify the iron concentration
in the magnetic TSLs for predicting the drug release induced by MH.
Acknowledgements
This work was supported by a Grant-in-Aid for Scientific Research
(Grant Number: 25282131) from the Japan Society for the Promotion of
Science (JSPS).
Declaration of interest
The authors report no conflicts of interest.