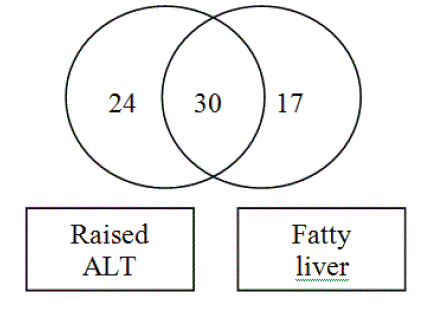
Figure 1: Distribution of participants with elevated ALT and fatty liver.

Tahniyah Haq1* Muhammad Abdul Hannan2 Muhammad Abul Hasanat1 Muhammed Fariduddin1
1Department of Endocrinology, Bangabandhu Sheikh Mujib Medical University (BSMMU), Dhaka, Bangladesh*Corresponding authors: Tahniyah Haq, Department of Endocrinology, Bangabandhu Sheikh Mujib Medical University, Shahbag, Dhaka 1000, Room 1620, 16th Floor, Block D, Bangladesh, Tel: +88-01677791735; E-mail: tahniyah81@bsmmu.edu.bd
Background: Liver is a central organ in the pathogenesis of insulin resistance and increased cardiometabolic risk. Alanine transaminase reflects hepatocyte injury and steatosis.
Aim: To see the association between alanine transaminase and cardiometabolic risk in overweight and obese children.
Methods: The study was done in 88 overweight and obese 6-18 year old children from January 2017 to March 2018. Serum alanine transaminase and cardiometabolic risk factors (obesity, hypertension, dyslipidaemia, insulin resistance, hyperuricaemia and raised C-reactive protein) were measured.
Results: Diastolic blood pressure (77.49 ± 9.44 vs. 72.06 ± 7.50 mmHg, p=0.006), insulin resistance (5.22 ± 4.36 vs. 3.48 ± 1.77, p=0.016) and fasting plasma glucose (4.89 ± 0.91 vs. 4.53 ± 0.55 mmol/l, p=0.038) were significantly higher in participants with raised alanine transaminase. Alanine transaminase increased with increasing waist circumference (r=0.263, p=0.013), systolic blood pressure (r=0.258, p=0.015), diastolic blood pressure (r=0.334, p=0.001), insulin resistance (r=0.452, p=0.001), HbA1c (r=0.303, p=0.004), uric acid (r=0.267, p=0.012) and C-reactive protein (r=0.348, p=0.001). After adjusting for cardiometabolic risk factors, only insulin resistance (β=3.01, p<0.001) and uric acid (β=4.99, p=0.015) were related with alanine transaminase. In addition, alanine transaminase was higher in those with metabolic syndrome (39.07 ± 25.94 vs. 28.48 ± 19.27 U/L, p=0.033).
Conclusion: Elevated alanine transaminase was associated with cardiometabolic risk, particularly insulin resistance and raised uric acid.
Alanine transaminase; Insulin resistance; Cardiometabolic risk; Obesity
Alanine transaminase (ALT) is the most important enzyme/marker of hepatocyte injury [1]. It also reflects fat accumulation in the liver [2]. Hepatic insulin resistance leads to deposition of fat in the liver. It also causes hyperglycaemia, hyperinsulinaemia by impaired inhibition of glucose production and dyslipidaemia by increased VLDL synthesis. Several studies have shown an association between ALT and different cardiometabolic risk factors such as insulin resistance, dyslipidaemia, hypertension and obesity in the adult population [3-8].
It is evident that the liver is a central organ in the pathogenesis of insulin resistance and increased cardiometabolic risk. Since ALT is a marker of liver injury, we wanted to investigate the relation of this enzyme with cardiometabolic risk. Furthermore, as there is limited data in the pediatric population, the aim of the study was to determine the 1) Association between ALT and cardiometabolic risk and 2) Cardiometabolic risk factors predicting elevated ALT in overweight and obese children.
Overweight and obese 6-18 year old children were recruited at Bangabandhu Sheikh Mujib Medical University (BSMMU) from January 2017 to March 2018 by purposive non-probability sampling. Those with secondary obesity, liver disorders in last four weeks and drugs altering liver function, alcohol intake and family history of liver disease were excluded. The study was approved by Institutional Research Board, BSMMU (No. BSMMU/2017/24).Written informed assent was taken from each participant.
Overweight and obesity was determined by calculating body mass index (BMI) which was plotted on Centers for Disease Control (CDC) chart. ALT was measured and fatty liver was determined by ultrasonography. Participants were divided into 2 groups depending on their level of ALT. Cardiometabolic risk factors (central obesity, hypertension, impaired fasting glucose or diabetes mellitus, insulin resistance, dyslipidemia, raised uric acid and C-reactive protein (CRP)) were determined by clinical examination and laboratory investigation.
Weight was measured using an electronic digital weighing machine to the nearest 0.1 kg, with the participant wearing light clothes and without shoes. Height was measured by a portable wall-mounted stadiometer to the nearest 0.1 cm with the participant without shoes in the erect position, back against the wall with his/her head held in Frankfurt horizontal plane with a right-angled triangle resting on the scalp and against the wall. Waist circumference (WC) was measured midway between the lowest rib and the superior border of the iliac crest by using a non-extensible and non-elastic measuring tape in mid respiration and inferences were drawn in percentiles. Waist height ratio (WHtR) was calculated by the formula WC in centimeters divided by body height in centimeters [9]. Blood pressure was measured according to method described by the Seventh Report of the Joint National Committee [10]. It was measured three times by the same individual with aneroid sphygmomanometer (Yamasu) after calibration and standardization and mean value was recorded. Ten ml of venous blood was collected after a 12 hour fast for ALT, fasting glucose, fasting insulin, HbA1C, lipid profile, uric acid and CRP. ALT and uric acid were measured by enzymatic method using Beckman Coulter AU680. Glucose was measured by hexokinase/G6-PDH method. Quantitative determination of serum insulin levels was done by chemiluminescent immunoassay method using Access Immunoassay System (REF- 33410) and HbA1c was measured using the NGSP certified method (Bio-Rad D-10TM Hemoglobin A1c Program 220-0101, USA). Cardiophase CRP reagent was used for the quantitative determination of CRP in human serum by means of particle enhanced immune nephelometry (BN 2 and BN prospec system). Total cholesterol (TC), triglyceride (TG), and high density lipoprotein (HDL) were measured by automated analyzer (Architect Plus ci8200). Low density lipoprotein (LDL) was calculated with the use of the Friedewald formula: LDL-C=TC-HDL-C-(TG/5). The Homeostasis model assessment of insulin resistance (HOMA-IR) index (a measure of insulin resistance) was calculated as the product of the fasting plasma insulin level (mU/L) and the fasting plasma glucose level (mM/L), divided by 22.5 [11]. USG of hepatobiliary system (HBS) was done to determine the presence or absence of liver fat by an experienced sonologist.
The CDC age- and sex-specific growth chart was used to classify participants as overweight and obese. Overweight was defined as body mass index (BMI) at or greater than 85th to less than 95th percentile and obesity as BMI at or greater than 95th percentile for age and sex [12]. Raised ALT was defined as >25.8 U/L in boys and 22.1 U/L in girls, which corresponds to 95th percentile [13]. Fatty liver was detected by ultrasound evidence of fatty changes in the liver. Because the BMI varies according to age, we standardized the value for age and sex with the use of conversion to a z score from the website [14]. Central obesity was defined as waist circumference (WC) ≥ 90 percentile and/or waist height ratio (WHtR) ≥ 0.5 [15]. Hypertension was taken as systolic and/or a diastolic blood pressure ≥ 95th percentile for age, gender, and height according to the “Fourth Report on Diagnosis, Evaluation, and Treatment of High Blood Pressure in Children and Adolescents [16,17]. HOMA-IR value above 3 (corresponds to the 95th percentile healthy reference children) was regarded as presence of insulin resistance [18]. Impaired fasting glucose (IFG) was defined as fasting plasma glucose (FPG) levels between 5.6 and 6.9 mmol/l and diabetes when FPG ≥ 7 mmol/l [19]. Dyslipidemia was defined as at least one abnormal blood lipid value for HDL, LDL, TC, or TG [20]. Table 1 below shows abnormal cutoffs of individual blood lipids in children. The cut point of raised CRP for increased cardiovascular risk was taken at 2 mg/l [21,22]. The cut point for elevated uric acid was taken at 5.5 [23]. The definition for metabolic syndrome in children was taken from National Cholesterol Education program (NCEP) [15] in which children must have at least three of the given criteria: 1) Serum Triglyceride ≥ 110 mg/dL, 2) Serum HDL-C ≤ 40 mg/dL, 3) Fasting plasma glucose ≥ 100 mg/dL, 4) Waist circumference ≥ 90th percentile for age and gender and 5) systolic or diastolic blood pressure ≥ 90th percentile for age and sex.
| Category | Acceptable (mg/dl) | Borderline (mg/dl) | High(mg/dl) |
| TC | <170 | 170-199 | ≥ 200 |
| LDL-C | <110 | 110-129 | ≥ 130 |
| HDL-C | >45 | 45-40 | <40 |
| TG (years) | |||
| 0-9 | <75 | 75-99 | ≥ 100 |
| 10-19 | <90 | 90-129 | ≥ 130 |
Table 1: Plasma lipid ranges for children and adolescents [20].
All values were expressed as mean ± SD or frequencies. Students independent t test and one way ANOVA was used to compare the means of cardio-metabolic risks among participants with different levels of ALT. The correlation between two variables was studied with the Pearson’s correlation coefficient test. Multiple linear regression (backward method) and logistic regression were used to evaluate the association between cardiometabolic risk factors and ALT. The SPSS version 23.0 was used for the statistical analyses.
The study included 88 participants. The mean ALT level was 35.82 ± 24.47 U/L, with a range of 11 to 127 U/L. 54 (61.4%) had raised ALT, 47 (53.4%) had fatty liver, and 30 (34.1%) had both raised ALT and fatty liver (Figure 1).
Figure 1: Distribution of participants with elevated ALT and fatty liver.
Diastolic blood pressure (77.49 ± 9.44 vs. 72.06 ± 7.50 mmHg, p=0.006), HOMA-IR (5.22 ± 4.36 vs. 3.48 ± 1.77, p=0.016) and fasting plasma glucose (4.89 ± 0.91vs. 4.53 ± 0.55 mmol/l, p=0.038) were significantly higher in participants with raised ALT (Table 2).
| Variables | Elevated ALT n=54 Mean ± SD | Normal ALT n=34 Mean ± SD | P value |
| Age (years) | 11.56 ± 2.75 | 11.35 ± 2.70 | 0.74 |
| BMI z score | 2.21 ± 0.33 | 2.16 ± 0.40 | 0.52 |
| WC (cm) | 93.94 ± 12.37 | 90.59 ± 10.51 | 0.19 |
| WHtR | 0.622 ± 0.06 | 0.617 ± 0.05 | 0.69 |
| SBP (mmHg) | 111.48 ± 13.36 | 107.44 ± 10.07 | 0.13 |
| DBP (mmHg) | 77.49 ± 9.44 | 72.06 ± 7.50 | 0.006 |
| HOMA-IR | 5.22 ± 4.36 | 3.48 ± 1.77 | 0.016 |
| FPG (mmol/l) | 4.89 ± 0.91 | 4.53 ± 0.55 | 0.038 |
| HbA1c (%) | 5.73 ± 0.83 | 5.50 ± 0.42 | 0.14 |
| TC (mg/dl) | 170.31 ± 35.36 | 191.59 ± 45.75 | 0.016 |
| LDL-C (mg/dl) | 104.34 ± 27.81 | 119.21 ± 46.31 | 0.09 |
| HDL-C (mg/dl) | 36.85 ± 8.84 | 38.47 ± 5.90 | 0.31 |
| TG (mg/dl) | 154.94 ± 69.43 | 176.71 ± 131.32 | 0.38 |
| Uric acid (mg/dl) | 5.46 ± 1.29 | 5.12 ± 1.09 | 0.20 |
| CRP (mg/dl) | 7.72 ± 7.81 | 7.09 ± 6.90 | 0.70 |
Table 2: Cardio-metabolic risk factors in the study population (n=88).
Comparison by student’s independent t test
Significantly greater number of participants with elevated ALT had diastolic hypertension (55.6 vs. 32.4%, p=0.028) (Table 3).
| Variables | Elevated ALT n=54 n (%) | Normal ALT n=34 n (%) | P value |
| Systolic HTN/Pre HTN | 13 (24.1) | 5 (14.7) | 0.42 |
| Diastolic HTN/Pre HTN | 30 (55.6) | 11 (32.4) | 0.03 |
| Prediabetes/diabetes | 06 (11.1) | 01 (2.9) | 0.24 |
| Insulin resistance | 31 (64.6) | 17 (51.5) | 0.26 |
| Raised TC | 28 (51.9) | 21 (61.8) | 0.39 |
| Raised LDL | 23(42.6) | 15 (44.1) | 1 |
| Low HDL | 44 (81.5) | 28 (82.5) | 1 |
| Raised TG | 47 (87.0) | 31 (91.2) | 0.74 |
| Raised uric acid | 23 (42.6) | 10 (29.4) | 0.15 |
| Raised CRP | 44 (81.5) | 28 (82.4) | 1 |
Table 3: Frequency of cardio-metabolic risk factors in study population (n=88).
Comparison by chi square test.
Participants in the highest tertile of ALT had a significantly greater WC, WHtR, DBP, HOMA-IR and HbA1c than the lower tertiles (Table 4).
| ALT | 1st tertile <22 U/L (n=31) | 2nd tertile 22-36.3 U/L (n=28) | 3rd tertile >36.3 U/L (n=29) | p value |
| BMI z score | 2.18 ± 0.43 | 2.12 ± 0.26 | 2.29 ± 0.37 | 0.19 |
| WC(cm) | 90.89 ± 11.19 | 89.26 ± 7.83 | 97.97 ± 14.02 | 0.009 |
| WHtR | 0.617 ± 0.05 | 0.603 ± 0.05 | 0.641 ± 0.06 | 0.03 |
| SBP (mmHg) | 108.50 ± 10.33 | 107.27 ± 12.75 | 114.12 ± 12.83 | 0.07 |
| DBP (mmHg) | 72.43 ± 7.77 | 73.91 ± 7.96 | 79.83 ± 9.95 | 0.004 |
| FPG (mmol/l) | 4.53 ± 0.53 | 4.72 ± 0.57 | 4.99 ± 1.12 | 0.09 |
| HOMA-IR | 3.44 ± 1.84 | 3.44 ± 1.88 | 6.91 ± 5.24 | 0.001 |
| HbA1c (%) | 5.46 ± 0.41 | 5.53 ± 0.35 | 5.92 ± 1.07 | 0.03 |
| TC (mg/dl) | 189.18 ± 38.17 | 169.87 ± 43.35 | 177.52 ± 39.44 | 0.12 |
| TG (mg/dl) | 180.54 ± 143.76 | 138.48 ± 53.86 | 173.34 ± 75.38 | 0.13 |
| LDL-C (mg/dl) | 115.02 ± 40.37 | 105.69 ± 39.23 | 110.01 ± 29.83 | 0.63 |
| HDL-C (mg/dl) | 38.57 ± 6.33 | 37.87 ± 7.78 | 36.00 ± 9.15 | 0.42 |
| Uric acid (mg/dl) | 5.16 ± 1.01 | 5.08 ± 1.23 | 5.76 ± 1.32 | 0.07 |
| CRP (mg/dl) | 7.23 ± 7.52 | 6.54 ± 4.21 | 8.72 ± 9.78 | 0.82 |
Table 4: Comparison of cardio-metabolic risk factors among 3 tertiles of ALT (n=88).
Comparison done by one-way ANOVA. Tukey’s post hoc analysis showed significant difference in WC and WHtR between 2nd vs. 3rd tertile
In DBP between 1st vs. 3rd and 2nd vs.3rd tertile
In HOMA-IR between 1st vs. 3rd and 2nd vs. 3rd tertile
In HbA1c between 1st vs. 3rd tertile
ALT was significantly higher in children with metabolic syndrome (39.07 ± 25.94 vs. 28.48 ± 19.27 U/L, p=0.033) (Table 5).
| Variables | Metabolic syndrome present (n=61) Mean ± SD |
Metabolic syndrome absent (n=27) Mean ± SD | p-value |
| ALT (U/L) | 39.07 ± 25.94 | 28.48 ± 19.27 | 0.03 |
Table 5: Comparison of ALT between participants with and without metabolic syndrome (n=88).
Comparison by student’s independent t test.
There was a significant positive correlation between ALT and WC (r=0.263, p=0.013), SBP (r=0.258, p=0.015), DBP (r=0.334, p=0.001), HOMA-IR (r=0.452, p=0.001), HbA1c (r=0.303, p=0.004), uric acid (r=0.267, p=0.012), CRP (r=0.348, p=0.001) (Table 6).
| Variables | r | P value |
| BMI z score | 0.025 | 0.82 |
| WC (cm) | 0.263 | 0.013 |
| WHtR | 0.185 | 0.08 |
| SBP (mmHg) | 0.258 | 0.015 |
| DBP (mmHg) | 0.334 | 0.001 |
| FPG (mmol/l) | -0.021 | 0.84 |
| HOMA-IR | 0.452 | 0.001 |
| HbA1c (%) | 0.303 | 0.004 |
| TC (mg/dl) | 0.061 | 0.57 |
| LDL-C (mg/dl) | 0.011 | 0.92 |
| HDL-C (mg/dl) | -0.067 | 0.53 |
| TG (mg/dl) | 0.144 | 0.18 |
| Uric acid (mg/dl) | 0.267 | 0.012 |
| CRP (mg/dl) | 0.348 | 0.001 |
Table 6: Correlation of ALT with cardiometabolic risk factors (n=88).
There was a significant relation of ALT with HOMA-IR and uric acid after adjusting for BMI, waist circumference, blood pressure, plasma glucose, blood lipids and CRP. ALT increases by 3.01 and 4.99 U/L when HOMA-IR and uric acid increase by 1 unit respectively (ALT=-4.39+3.01 HOMA-IR+4.99 uric acid) (Table 7).
| Cardiometabolic risk factor | Beta | P value |
| HOMA-IR | 3.01 | < 0.001 |
| Uric acid (mg/dl) | 4.99 | 0.015 |
Table 7: Multiple linear regression with ALT as dependent variable (n=88).
Cardiometabolic risk factors did not significantly increase risk of having raised ALT and accounted for only 13% of its variance (Table 8).
| Cardiometabolic risk factor | (Exp B) OR | P value |
| Systolic hypertension | 0.78 | 0.74 |
| Diastolic hypertension | 3.05 | 0.06 |
| Prediabetes/diabetes | 6.87 | 0.12 |
| Insulin resistance | 1.16 | 0.78 |
| Raised TC | 0.61 | 0.46 |
| Raised LDL | 1.03 | 0.96 |
| Low HDL | 0.72 | 0.39 |
| Raised TG | 1.23 | 0.64 |
| Raised uric acid | 1.85 | 0.27 |
| Raised CRP | 0.92 | 0.92 |
Table 8: Logistic regression with raised ALT as dependent variable (n=88).
This study examined the association between ALT and cardiometabolic risk factors in overweight and obese children. We found that waist circumference, WHtR, diastolic blood pressure and insulin resistance were higher in those with elevated ALT, irrespective of fatty liver. ALT increased with increasing waist circumference, systolic and diastolic blood pressure, insulin resistance, uric acid and CRP. However, after adjusting for cardiometabolic risk factors, only insulin resistance and uric acid were related with ALT. In addition, ALT was higher in those with metabolic syndrome.
Waist circumference was higher in those with elevated ALT. This was also found in another study [3]. There is a positive association between BMI, waist circumference and waist: hip ratio with nonalcoholic fatty liver disease [7,24]. There is a significant correlation between pediatric visceral adiposity index (which includes waist circumference) and ALT [25]. AST, ALT and GGT are related to hepatic steatosis in healthy Asians [26].
Diastolic blood pressure was higher in those with elevated ALT and predicted development of raised ALT with fatty liver. Other studies have shown similar results between blood pressure and ALT [3,27]. Contrary to this study, blood pressure was shown to increase across quartiles of ALT and GGT, but only GGT increased risk of hypertension [28]. Carotid-femoral pulse wave velocity and blood pressure were higher in people with raised ALT levels [29]. Hepatic insulin resistance may play a role in explaining the relation between elevated liver enzymes and hypertension, as it is associated with an increased risk of incident hypertension [28].
Uric acid was higher in those with elevated ALT and fatty liver. It was related to ALT after adjusting for other cardiometabolic risk factors. Similar to this study, Chen S, et al. found that raised uric acid increased risk of altered ALT [3].
Insulin resistance was higher in those with elevated ALT. Furthermore, HOMA-IR was linearly related with ALT after adjusting for other cardiometabolic risk factors. Elevated HOMA-IR also increased risk of developing raised ALT with fatty liver. This is in accordance with other studies which have shown that HOMA-IR is significantly correlated with liver function markers [4]. Patients with raised ALT are also more prone to develop diabetes and metabolic syndrome [5]. However, a three year cohort study has shown that gamma-glutamyltransferase (GGT), and not ALT predicted risk of developing diabetes [2].
ALT was found to be higher in patients with metabolic syndrome. Both ALT and GGT, but not AST strongly predict metabolically unhealthy obesity [6]. There is a greater risk of developing metabolic syndrome and increased 10 year ASCVD risk in individuals with higher normal ALT levels [30]. On the other hand, metabolic syndrome increased risk of both steatohepatitis and hepatocyte injury [31].
The limitation of the study is that extensive investigations to determine causes of raised ALT were not done. Other markers of liver function were not addressed.
In conclusion, there is an association between cardiometabolic risk and ALT, particularly insulin resistance, uric acid and blood pressure.
We would like to thank BSMMU for funding the research and the department of Microbiology and Biochemistry, BSMMU for their technical support.
None of the authors have any conflict of interest.
Download Provisional PDF Here
Article Type: RESEARCH ARTICLE
Citation: Haq T, Hannan MA, Hasanat MA, Fariduddin M (2020) Association between Serum Alanine Transaminase and Cardiometabolic Risk in Overweight and Obese Children. Int J Endocrinol Metab Disord 6(1): dx.doi.org/10.16966/2380-548X.164
Copyright: © 2020 Haq T, et al. This is an open-access article distributed under the terms of the Creative Commons Attribution License, which permits unrestricted use, distribution, and reproduction in any medium, provided the original author and source are credited.
Publication history:
All Sci Forschen Journals are Open Access