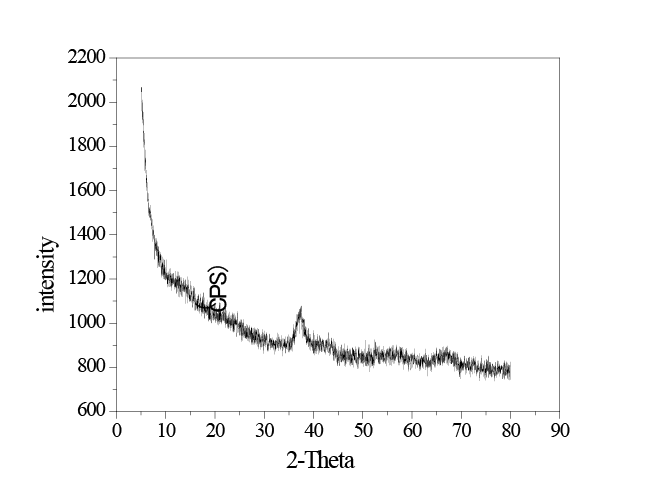
Figure 1: XRD pattern of the in situ MnO2

Yubin Zeng1,* Ziyang Zeng2
1Department of Water Quality Engineering, School of Power and Mechanical Engineering, Wuhan University, Wuhan 430072, China*Corresponding author: Yubin Zeng, Department of Water Quality Engineering, School of Power and Mechanical Engineering, Wuhan University, Wuhan 430072, China, Tel: +86 027 68772269; fax: +86 027 68772269; E-mail: zengyubin@whu.edu.cn
The adsorption removal of humic acid (HA) from micro-polluted water using manganese dioxide (MnO2 ) formed in situ, which was prepared through the oxidation of MnSO4 using KMnO4 ,was investigated through batch experiments including kinetics, thermodynamics and isothermal adsorption models with online dosing mode. The results of analysis by the UV254 and permanganate index CODMn methods indicates that HA removal reach 29.82% and 49.99%, respectively at amount of in situ MnO2 8 mg/L and contact time 2h. The kinetics data proves a closerfit to the pseudo-second order model.The isotherm data can be fit with Langmuir isotherm model well, and maximum adsorption capacity achieved 27.20 mg/g which is near to the experimental value 26.38 mg/g. Moreover, the thermodynamic analysis shows the HA adsorption on in situ MnO2 is a spontaneous and exothermic process. The excellent adsorption performance and low cost of the in situ MnO2 can be considered as one of the effective options to remove HA from micro-polluted water.
In situ MnO2 ; Humic acid; Online dosing mode; Adsorption
Humic acid (HA) is the primary organic compound in natural water, and the molecular weight of HA is between 300 and 3000. The HA content represents 60~90% of the total organic matter in water, and it exists in the form of colloidal particles in water [1,2]. Meanwhile, HA is one of the primary potential hazards in water [3,4].
Recently, studies on using environmental materials, which widely exist in nature, as adsorbents to remove pollutants from water have drawn great attention. Among these studies, progress has been made in applying manganese dioxide (MnO2 ) as environmental materials [5,6]. The natural forms of MnO2 include δ-MnO2 , γ-MnO2 , etc, and the properties of different forms of MnO2 are also different. Researches on using MnO2 for removing pollutants from water have mainly focused on oxidation and adsorption. Stone reported the redox reaction between a small molecular organic compound and MnO2 [7]. The organic compound was adsorbed on the surface of MnO2 to form a complex, and the chemical reaction process on the surface of MnO2 was the rate-controlling step. Liu and Tang studied the effect of mineral MnO2 on the removal of a dye (F3 B) [8]. Their results showed that both illumination and a low pH could promote the degradation of the dye. Other researchers have also publicized the synergistic effect of MnO2 on the oxidation and adsorption for heavy metal ions in water, such as chromium (Cr) and arsenic (As) [9,10].
On the subject of the adsorption of MnO2 , some research presented the effects of MnO2 on the removal of uranium (VI) and thallium (I) ions under different conditions [11,12]. Bernard et al. [13] studied the primary factor that affected the adsorption of organic pollutants (e.g., HA, tannic acid, etc.) onto MnO2 was the electronegativity of the surfaces of organic compounds. In addition, MnO2 tended to adsorb organic pollutants with a positive surface charge. On the other hand, the resultsobtained from Liu et al. showed that δ-MnO2 tended to adsorb HA with large molecular weights [14].
In situ MnO2 is generated from KMnO4 at the instant when KMnO4 is reduced. The particles of in situ MnO2 are small in size, and have a large specific surface area. Moreover, in situ MnO2 is more active and has stronger adsorption ability compared with mineral MnO2 [15,16]. Currently, studies on in situ MnO2 have primarily focused on the removal of heavy metals from water, such as cadmium (Cd), strontium (Sr), and lead (Pb). However, there are few studies on using in situ MnO2 to remove natural organic contaminants from micro-polluted water. Therefore, the aim of this study is to investigate the adsorption performance and behaviorof HA on in situ MnO2 using the on-line adding mode. The effects of different factors on the adsorption were studied. The adsorption process is described by different kinetic and isotherm models and thermodynamics to identify the adsorption mechanism. The results give us a better understanding of the adsorption behavior of HA onto in situ MnO2.
All the reagents used were analytical grade. The concentration of stock solution KMnO4 and MnSO4 was 4.6 mmol/L and 6.9 mmol/L, respectively. The raw water from East Lake of Wuhan, China was used in this investigation.
100 mL of raw water were added into conical flasks of 250 mL. Equivalent amounts of MnSO4 solution and KMnO4 solution were added into each conical flask successively. The conical flasks were then sealed and stirred atthe speed of 200 r/min andtemperature 298K for a certain time. UV254 and CODMn of each filtrate (0.45 μm pore filter) were measured. The effects of adsorption time, amount of in situ MnO2 and solution pH on the adsorption were studied.
The kinetics studies were investigated with sorbent dosages 8 mg/L, initial CODMn (4.31 mg/L, 13.02 mg/L) and temperatures 298K with contact time ranging from 0 to 4.0h, and samples were taken at regular intervals from the reaction solution and filtered (0.45 μm pore filter) for UV254 and CODMn analysis.
The adsorption isotherm experiments were studied by varying the initial HA concentration from 5.0 to 11.0 mg/L at temperatures 298K, 308K, and 318K.
All samples were prepared in duplicate, and average values of the replicated measurements were reported in all experiments. The amount of adsorbed HA, q (mg/g) was calculated using equation:
$$q = V{{{C_o} - {C_e}} \over M}.......................(1)$$
Where q is the amount of adsorbed HA, C0 is the initial HA concentration, Ce is the equilibrium HA concentration, V is the volume of the solution and M is the mass of the in situ MnO2 .
The HA removal efficiency (%) was considered in percent as
$${\rm{Removal (\% )}} = 100 - 100{C_{el}} - {C_o}.......................(2)$$
X-ray diffraction (XRD) were performed to confirm the crystal structure and identity using X-ray Diffracto meter (Rigaku D/MAX-RB, Japan) with Cu Kα radiation in the 2θ ranges of 5° ~80° at a scan rate of 1° / min. The surface structures of samples were determined using scanning electron microscopy method (SEM, JSM-5610LV, and Japan). The characterizations of the samples were carried out at their optimal working conditions.
A glass pH electrode (PHS-25, China) was used for pH measurement. The permanganate index was calculated as the chemical oxygen consumption using potassium permanganate solution as the oxidant, which is denoted as CODMn, in accordance with the standards [17]. The UV254 absorbance was defined as the absorbance of some organic matter in water in the presence of ultraviolet light with a wavelength of 254 nm. UV254 can reflect the content of natural organic matter such as HA, molecules that consists of conjugated double bonds, and aromatic compounds with C=O functional groups. The UV254 was measured using a UV-1600 UV/V is spectrophotometer.
The XRD pattern of the in situ MnO2 is shown in Figure 1. The diffraction peak of the in situ MnO2 is relatively weak and wide, which indicates low crystalline structure. Analyzing the XRD pattern as a whole, only one peak is apparent, which suggests that the purity of the in situ MnO2 was relatively high. Given that the diffraction peak is at 2θ = 37.17°, a comparison with powder diffraction patterns indicates that the nature of the manganese dioxide is γ-MnO2 [18].
Figure 2 shows the SEM image of the in situ MnO2 . It can be observed that the in situ MnO2 particles are amorphous in nature, with a maximum diameter of approximately 120 nm. With an aging time of 30 min, the in situ MnO2 is observed to coagulate into clusters. There is a tendency of increasing aggregation with increasing concentration of the in situ MnO2 .

Figure 1: XRD pattern of the in situ MnO2
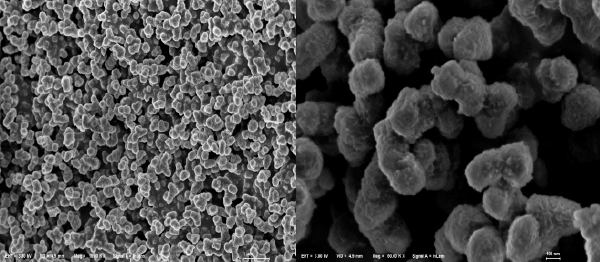
Figure 2: SEM images of the in situ MnO2
Figure 3 displays the effect of time on adsorption of HA at a fixed initial UV254 0.52 and initial CODMn 13.02 mg/L with sorbent dosages 8 mg/L at 298K. As the adsorption time increased, HA removal by UV254 and CODMn methods increased. When the adsorption process continued for 2h, HA removal by UV254 and CODMn methods were 24.00% and 44.69%, respectively. However, HA removal by CODMn method remained the same after 2 h, therefore, when the adsorption process continued for 2 h the adsorption of HA on in situ MnO2 reached equilibrium.
According to adsorption theory, during the initial adsorption stage, there was no HA on the surface of and inside in situ MnO2 ; however, the HA content in the solution was at its highest, and thus, HA could be rapidly adsorbed onto the surface of in situ MnO2 . As time increased, more HA was adsorbed on to in situ MnO2 ; thus, the removal rates of HA also gradually increased. When all of the adsorption sites of in situ MnO2 were saturated and in adsorption/desorption dynamic equilibrium, the adsorption capacity of in situ MnO2 for HA would no longer increase as time increased, and thus, HA removal remained the same.
As shown in Figure 4, when more in situ MnO2 was added, HA removal exhibited a clear trend, in which they first increased and then leveled off; when the amount of added in situ MnO2 was 8 mg/L, HA removal by UV254 and CODMn methods leveled off, which were 29.82% and 49.99%, respectively.
The curve is divided into three stages. During the first stage, the added amount of in situ MnO2 was 0 ~ 6 mg/L and its content was low; therefore, the generated MnO2 could rapidly disperse into the solution. In addition, the interaction between MnO2 particles was relatively weak, and the HA content was relatively high at this time; thus, the adsorbent was “surrounded” by the adsorbate, and the adsorbent could fully adsorb the adsorbate. Consequently, as the amount of in situ MnO2 increased the removal of HA by UV254 and CODMn methods increased linearly. During the second stage, the concentration of in situ MnO2 increased from 6 mg/L to 10 mg/L. HA removal continued to increase, though at a slower rate, which might be due to the increasing concentration of in situ MnO2 , which would generate a certain interaction between MnO2 particles that affects the adsorption effect. During the third stage, the content of in situ MnO2 increased from 10 mg/L to 20 mg/L, whereas HA removal did not increase significantly, instead tending to level off for the reason that polymerization between MnO2 particles could occur with the continuously increasing concentration of in situ MnO2 . Thus, with increasing concentration, the number of the adsorption sites of in situ MnO2 did not increase, and continuously increasing the amount of adsorbent had no impact on the adsorption effect.
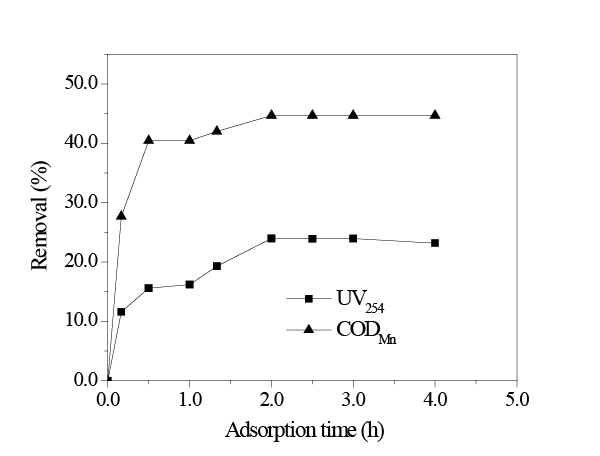
Figure 3:Effect of adsorption time (amount of in situ MnO2 8 mg/L; initial UV254 = 0.52; initial CODMn= 13.02 mg/L; temperature 298K; pH = 8.0.)
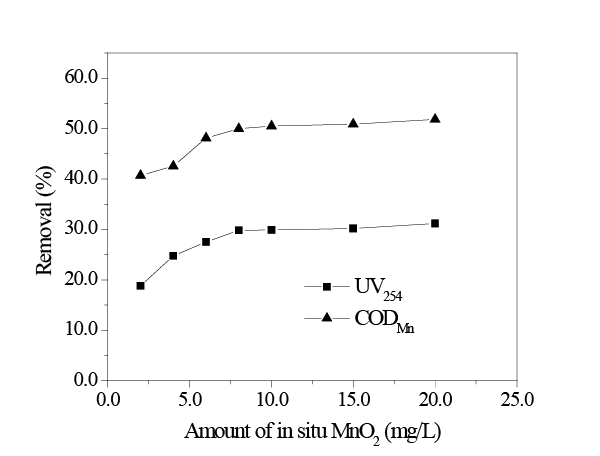
Figure 4: Effect of amount of in situ MnO2 on adsorption (initial UV254 = 0.52; initial CODMn = 13.02 mg/L; temperature 298K; pH = 8.0; adsorption time 2h.)
As shown in Figure 5, when the pH = 2.0, HA removal by UV254 and CODMn methods were 49.59% and 47.52%, respectively, which were higher than those under the alkaline condition. When the pH = 4.0, HA removal decreased rapidly. However, HA removal by UV254 and CODMn methods increased when the pH increased to 6.0 and above 6.0.
The pH affected the adsorption of HA on in situ MnO2 by two aspects: on one hand, the pH variation changes the surface properties of in situ MnO2 , which in turn, affects the adsorption effect. On the other hand, the pH variation changes the existing forms of HA in the solution. When pH>6.0, HA existed in ionic forms (HA- and A2-) in water; in situ MnO2 could adsorb HA through van der Waals forces, hydrophobic interaction, and hydrogen bond interaction. The removal of HA was approximately 40% under this condition. When pH<4.0, HA existed in the form of HA molecules in water. Because HA is difficult to dissolve in water, the interaction between in situ MnO2 and HA molecules was weakened, and therefore, under this acidic condition, the adsorption effect of in situ MnO2 on HA decreased. In addition, under an acidic condition, the yield of MnO2 also decreased, which decreased the amount of the adsorbent. When the pH = 2.0, the removal of HA were higher than those under the alkaline condition, due to the fact that under the strong acidic condition (pH<3.8), in situ MnO2 was a strong oxidant and thus, could oxidize HA.
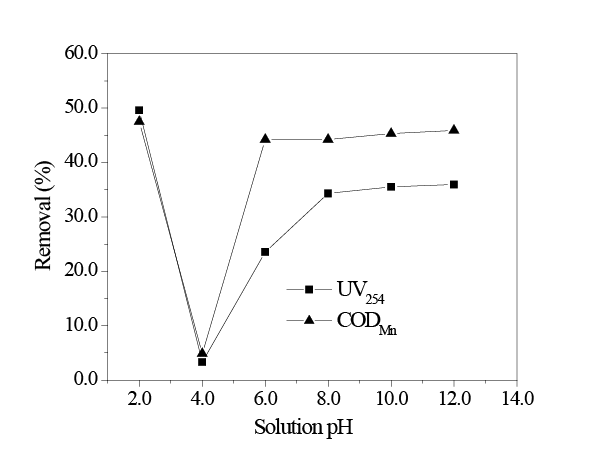
Figure 5: Effect of solution pH on adsorption (initial UV254 = 0.52; initial CODMn = 13.02 mg/L; amount of in situ MnO2 8mg/L; temperature 298K; adsorption time 2h.)
Adsorption kinetic models can be useful to determine the mechanismof adsorption and the efficiency of the adsorbents for theremoval of pollutants. In this study, for the interpretation of the kinetic batch experimental data threedifferent kinetic models were used: (1) the pseudo-first order kinetic model (Equation 3) [19-21], (2) the pseudo-second order kinetic model (Equation 4) [20,22,23] and (3) the intraparticle diffusion model (Equation 5) [20,24].
The pseudo-first order kinetic could be shown by Equation 3:
$${\rm{ln(}}{q_e} - {q_t}) = h{q_e} - {k_1}t.......................(3)$$
Where, qe (mg/g) and qt (mg/g) are the amounts of HA adsorbedon the in situ MnO2 at equilibrium and at time (t), respectively. K1 (1/h) is the pseudo-first order rate constant. K1 and qe were determined from the slope and intercept of the linear plot of ln(qe −qt ) againstt, respectively. The pseudo-second order kinetic modelcan be expressed as [25]:
$${t \over {{q_t}}}{\rm{ = }}{1 \over {{k_2}{q_e}^2}}{\rm{ + }}{{1 \over {{q_e}}}^{}}t......................(4)$$
$$h = {k_2}{q_e}^2..........{\rm{Equation}}(5)$$
Where qe is the amount sorbed at equilibrium (mg/g), k2 is the equilibrium rate constant of pseudo-second order (g/mg h), and h is the initial adsorption rate (mg/g h). These constants can be determined by plotting t/qt against t.
The intraparticle diffusion kinetic (Weber-Morris diffusionmodel) is shown by the followingequation [26]:
$${q_t} = {k_i}_d{t^{1/2}} + C..........{\rm{Equation}}(6)$$
Where, Kid (g/mg h) is the rate constant of the in teraparticle diffusion kinetic model. The value of C and Kid are obtained from theintercept and slope of the linear plotted of qt against t1/2, respectively.
It can be seen from the Figure 6 that the adsorption capacity of in situ MnO2 increased as the initial concentration of HA increased. When the initial HA concentrationincreased from 4.31 mg/L to 13.02 mg/L, the qe of HA adsorption on in situ MnO2 increased accordingly from 24.08 mg/g to 27.52 mg/g.
The adsorption of HA on in situ MnO2 is classified into three stages: rapid adsorption stage, slow adsorption stage, and adsorption equilibrium stage. The rapid adsorption stage refers to the period that was within 30 min after in situ MnO2 was added, where qt reached 73.96% of the qe . At this stage, in situ MnO2 was just added into the HA solution, and there were large amounts of adsorption sites on the surface of in situ MnO2 . Additionally, the amount of HA in the solution was at its greatest. The second stage was the slow adsorption stage, at which time, large amounts of HA molecules had already been adsorbed onto the surface of in situ MnO2 , though adsorption had not reached equilibrium. In situ MnO2 continued to adsorb HA in the solution; however, the adsorption rate was far slower than that during the first stage. The third stage was the adsorption equilibrium stage; when the adsorption process continued for more than 1 h (Figure 6), large amounts of HA had been adsorbed onto the surface of in situ MnO2 . Additionally, adsorption had essentially reached equilibrium. Therefore, the adsorption of HA on in situ MnO2 was in adsorption/desorption dynamic equilibrium during this stage, and hence, the adsorption capacity would no longer increase as the adsorption time increased.
Pseudo-first order kinetics (Figure 7a) and pseudo-second order kinetics (Figure 7b) were used to fit the process of the adsorption of HA on in situ MnO2 . Table 1 lists the obtained related parameters. The values of R2 from the pseudo-second order kinetics were 0.9999 and 0.9891 at different initial CODMn, and the adsorption process of HA on in situ MnO2 fits more with the pseudo-second order kinetics compared with the pseudo-first order kinetics. The qe of obtained from the pseudo-first order kinetics was 7.70 mg/g and 15.52 mg/g at different initial CODMn. However, the qe obtained from the pseudo-second order kinetics was 24.01 mg/g and 27.20 mg/g, respectively. From the comparison with the qe obtained from the experiment values (24.08 mg/g and 26.38 mg/g), it was more reasonable to use pseudo-second order kinetics to describe the adsorption process of HA on in situ MnO2 .
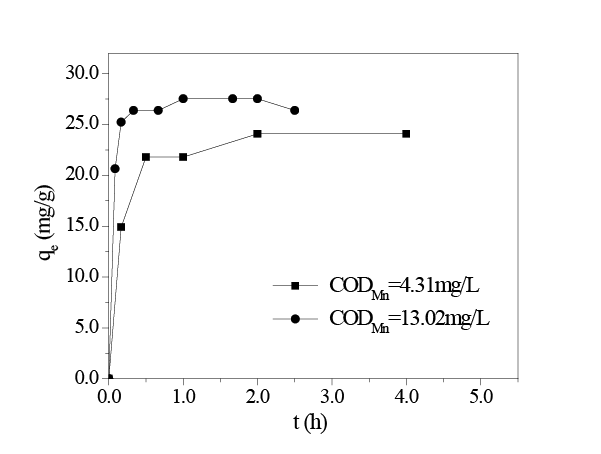
Figure 6: Adsorption capacity qe vs. adsorption time (amount of in situ MnO2 8 mg/L; initial CODMn = 4.31 mg/L, 13.02 mg/L; temperature 298K; pH = 8.0.)

Figures 7: (a) Linearized pseudo-first-order kinetic modelcurves; (b) Linearizedpseudo-second-order kinetic modelcurves; (c) Linearized Weber-Morris diffusion model curves.

Table 1: The parameters of pseudo-first-order, pseudo-second-order and Weber-Morris diffusion model kinetics
An internal mass-transfer model, the Webber-Morris model, was used to further analyze this adsorption process. In the Webber-Morris pore diffusion model, if pore diffusion is a rate-controlling process, then qt and t1/2 should satisfy a linear relationship, where the straight line passes through the origin point [25,27]. Figure 7c shows the relationship and fitting curves of qt and t1/2. The values of R2 of the adsorption process with different HAconcentrations obtained from Webber-Morris model were 0.8044 and 0.9271(Table 1). In addition, the straight line did not pass through the origin, which indicates that the internal diffusion process was notthe only rate-controlling process; butthere might be other ratecontrolling processes [27].
Langmuir and Freundlich, isotherms models are applied in this study. Langmuir isotherm is assumed that adsorption is a monolayer adsorption and the maximum adsorption occurs when molecules adsorbed on the surface of sorbent form a saturated layer. The Langmuir equation is
$${q_e} = {{{q_m}b{c_e}} \over {1 + b{c_e}}}{\rm{or}}{{{c_e}} \over {{q_e}^{}}}{\rm{ = }}{1 \over {{q_m}b}} + {{{{c_e}} \over {{q_m}^{}}}^{}}......................(7)$$
Where qe is the amount sorbed at equilibrium (mg/g), Ce is the equilibrium concentration (mg/L), qm is the maximum adsorption capacity (mg/g), and b is the adsorption intensity or Langmuir coefficient related to the affinity of the binding site (L/mg).
The Freundlich isotherm can be applied to non-ideal adsorption on heterogeneous surfaces as well as multilayer adsorption and is expressed by the following equation:
$${q_e} = {K_F}{C_e}^{1/n}.....................(8)$$
Where KF and 1/n are the constants that are related to the adsorption capacity and the adsorption intensity, respectively. This equation can be rearranged in the linear form by taking the logarithm of both sides as The values of KF and 1/n can be calculated by plotting lnqe against lnCe .
$$In{q_e} = In{K_F} + 1/nIn{C_e}.....................(9)$$
As shown in Figure 8, the adsorption capacity of in situ MnO2 increased as the initial concentration of HA increased. When the initial concentration of HA increased to 10 mg/L, the adsorption capacity of in situ MnO2 slowly leveled off.
Figures 9a and 9b represent the Langmuir and Freundlich adsorption isotherm curves of HA on in situ MnO2 at temperatures 298K, 308K, and318K. Table 2 shows the parameters of the curves. The values of correlation coefficients R2 show the adsorption behavior of HA on in situ MnO2 fits more with the Langmuir model than Freundlich model, which is consistent with the conclusion obtained from the study by Zhang [28].
It can be seen from Table 2 that when using the Langmuir isothermal adsorption model, the maximum adsorption capacity of in situ MnO2 for HA (qm) decreased as the temperature increased; at 298K, qm was as high as 161.03 mg/g; however, when the temperature reached 318K, qm was only 36.66 mg/g because adsorption is an exothermic process, and temperature increases can cause the adsorption/desorption equilibrium to shift towards the desorption direction.
To shed light on the HA adsorption on in situ MnO2 , the adsorption free energy (ΔG0 ), standardenthalpy (ΔH0 ) and standard entropy (ΔS0 ) were also calculated from the adsorption of HA on in situ MnO2 at various temperatures. Based on thermodynamic theory, the basic relationship is shown as the following Equations 10 and 11, respectively:
$$In{{{Q_e}} \over {{C_e}}} = {{\Delta {S^0}} \over R} - {{\Delta {H^0}} \over {RT}}....\sqrt {{a^2} + {b^2}} .................(10)$$
$$\Delta {G^0} = \Delta {H^0} - T\Delta {S^0}.................(11)$$
Where R is the gas constant (8.314 J mol-1 K-1) and T is the absolute temperature (K). Thus, ΔH0 and ΔS0 were obtained from the slope and intercept of the line plotted by ln(Qe /Ce ) versus 1/T , respectively.
Figure 10 show the relationship curves of lnqe /ce ~qe, andthe obtained thermodynamic parameters were listed in Table 3. The free energy (ΔG0 ) of the adsorption at all temperatures in the current study was negative, indicating that the adsorption process was spontaneous. The negative enthalpy change (ΔH0 ) suggested that the adsorption of HA on in situ MnO2 was an exothermic reaction, which was in accord with the decreasing adsorption capacity associated with increasing adsorption temperature. Also, the negative values of entropy (ΔS0 ) proposed decreased randomness at the solid-solution interface during the adsorption HA onto in situ MnO2 surface, and the negative entropy indicated that the mobility of HA onto the surface of in situ MnO2 became more restricted as compared with that of aqueous solution. It also showed that the driving force of HA adsorption on in situ MnO2 was due to an enthalpy change rather than an entropy effect.
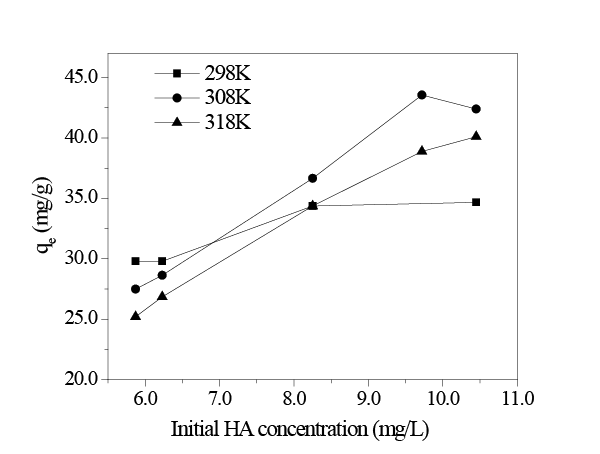
Figure 8: Adsorptioncapacities vs. initial HA concentration (pH = 8.0; adsorption time 2h; amount of in situ MnO2 8mg/L.)
In situ MnO2 exhibits a good adsorption effect on HA in micropolluted water. When the added amount of in situ MnO2 is 8mg/L and the adsorption time is 2 h, the removal of HA by UV254 and CODMn methods can reach 29.36% and 49.99%, respectively. The adsorption kinetics of HA onto in situ MnO2 can be well described by the pseudo-secondorder reaction model. Furthermore, the Langmuir model appears to fit the experimental data better than the Freundlich models for describing the adsorption behavior of HA from water on in situ MnO2 . The adsorption thermodynamics results suggest that the process of HAadsorption on in situ MnO2 is a spontaneous and exothermic process. Because of low cost, eco-friendly, non-toxicity and adsorption capacity of in situ MnO2 , this novel adsorbent canbe considered as one of the effective options to remove HA from micro-polluted water. Moreover, this study can provide scientific bases for the processes that use enhanced coagulation to remove HA from micro-polluted water.
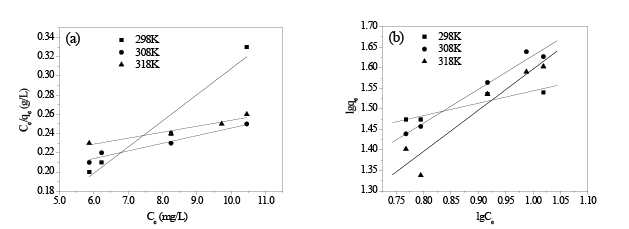
Figures 9: (a) Linearized Langmuir isotherm curves; (b) Linearized Freundlich isothermcurves

Table 2: The parameters of Langmuir and Freundlich isotherms at different temperatures

Table 3: Thermodynamic parameter for HA adsorption on in situ MnO2
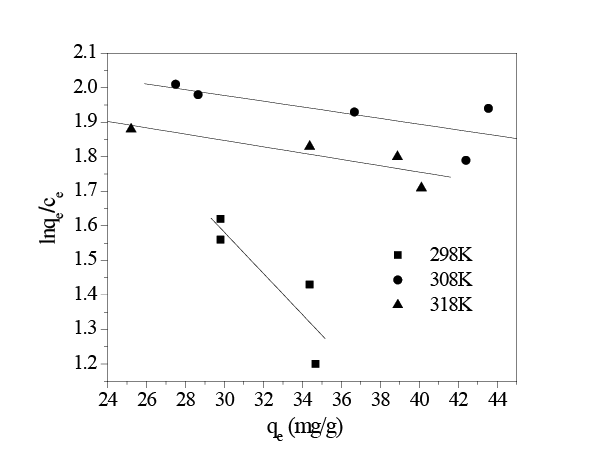
Figure 10: lnqe /ce ~qe relation curves
Even so, some directions and research need to be carried out in future, these issues include: (1) influences of the nature micro-polluted water and the HA-rich surface waters for the in situ MnO2 , (2) evaluation of natural organic matter (NOM) removal and disinfection by-product (DBPs) control by in situ MnO2 , (3) feasible technological strategies using in situ MnO2 to enhance the removal of NOM and to minimize DBPs formation, (4) assessment of a plant-scale application of in situ MnO2 combined with coagulant to enhance coagulation on the removal of NOM.
The authors thank to the planning project on innovation and entrepreneurship training of China Universityfor the financial support.
Download Provisional PDF Here
Aritcle Type: Research Article
Citation: Zeng Y, Zeng Z (2015) Adsorption Removal of Humic Acid from Micro-Polluted Water Using in Situ Manganese Dioxide. Int J Water and Wastewater Treatment 1(2): doi http://dx.doi. org/10.16966/2381-5299.110
Copyright: © 2015 Zeng Y. This is an open-access article distributed under the terms of the Creative Commons Attribution License, which permits unrestricted use, distribution, and reproduction in any medium, provided the original author and source are credited.
Publication history:
All Sci Forschen Journals are Open Access