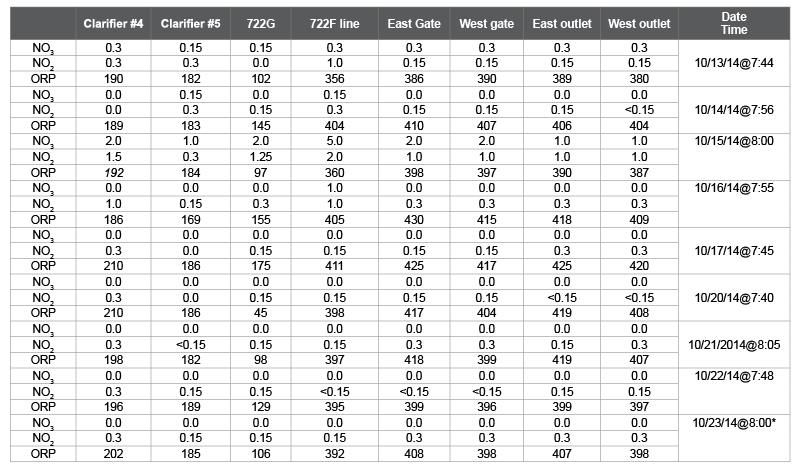
Table 1: The data collected at Northeast Water Reclamation facility for Oxidation Reduction Potential (ORP) in millivolts, Nitrate (NO3 ) and Nitrite (NO2 ) in milligram per liter

Nevein Narouz*
Chemist II, Water Resources Department, City Of Saint Petersburg, Florida, USA*Corresponding author: Nevein Narouz, Chemist II, Water Resources Department, City of Saint Petersburg, Florida, USA, Tel: 727-892-5699/727-892-5697; E-mail: Nevein.narouz@st.pete.org
The presence of nitrogenous organic compounds such as N-Chlorinated amino acids in wastewater results in the formation of organic chloramines, which has become a growing concern as they are considered a very weak disinfectant, and give false results in the N,N-Diethylp-Phenylenediamine titration for Chlorine residual as an indicator for efficient disinfection of the treated wastewater. In this study, the oxidation reduction potential was used as a reliable method to measure the efficacy of disinfection, and also as a tool for the explanation of the fecal coliform results at Northeast Wastewater Reclamation Facility, city of Saint Petersburg, Florida.
Oxidation reduction potential; Disinfection; Chlorine residual; Principle component analysis; Organic monochloramines
The presence of nitrogenous organic compounds such as N-Chlorinated amino acids in wastewater results in the formation of organic chloramines, which become a growing concern as they are considered a very weak disinfectant, and give false results in the N,N-Diethyl-pphynelenediamines titration for chlorine residual as an indicator for efficient disinfection of the treated wastewater. N-Chlorinated amino acids were identified in wastewater by McCormick et al. [1] along with the studies by Wolfe and Olson [2] concluded that the conventional analytical methods such as N,N-Diethyl-p-phynelenediamines (DPD) gives same results for inorganic monochloramines and organic chloramines which are not as powerful as inorganic monochloramines, in addition, Conyers and Scully [3] confirmed organic chloramines and monochloramine response to residual chlorine test is the same and they are stable in the presence of free residual chlorine. Afterwards, Yoon and Jensen [4] confirmed the transfer of inorganic chloramines into organic chloramines in wastewater. In line with White, “Handbook of Chlorination” [5], secondary biological wastewater treatment can produce soluble organic nitrogen concentrations in the range of 3-15 mg/L (as N). White also states that if the mixing of chlorine (either gaseous or liquid soda bleach) with the wastewater is poor, the chlorinated species will tend to split between monochloramine and organic chloramines. Several studies have shown that organic chloramines have significantly less germicidal activity than monochloramine.
Based on these studies, the efficacy of disinfection was investigated using Oxidation Reduction Potential probe. Samples were collected from different stages of the treatment process at Northeast Water Reclamation Facility, City of Saint Petersburg Florida, which included: Clarifiers 4 and 5, the effluent of the filters 722G, the east and west inlet after injecting the bleach, the east and west outlets of Chlorine contact chamber and the line for collecting the micro samples, 722F. These samples were collected every morning at the same time for the lab. The N,N-Diethyl-pphynelenediamines was taken immediately after collecting these samples; at that same time Chlorine residual was analyzed by the conventional N,N-Diethyl-p-phynelenediamines test for 722F site, plus Fecal Coli form using membrane filtration at Environmental Compliance Division lab for 722F site.
All chemicals were reagent grade or better, HACH water quality test strips had been used for Nitrate and Nitrite immediate measurements, EUTECH ORP Teste10 meter used for the Oxidation Reduction Potential readings at different sites along with Monochloramine and Chlorine residual N,N-Diethyl-p-phynelenediamines titration according to Standard Method 4500-Cl ,KIMAX flask, 250 ml was used for titrations.
In 2 liters volumetric flask adds the following: 3.00 ml 6N Sulfuric acid, 2.212 grams Ferrous ammonium sulfate, dissolve then bring the volume to 2l with DI.
Fill ¾ of 2L volumetric flask then add the following: 0.40 g Disodium ethylenediamine tetracetate dihydrate (EDTA), 2.00 g N, N-Diethyl-pPhenylenediamine, Oxalic acid salt and 24.0 ml 6N Sulfuric acid, dissolve then bring the volume to 2 liters with de ionized water.
KI, crystals
Dissolve 500 mg KI and dilute to 100 ml with de ionized water and keep in brown bottle.
Fill ¾ of 2L volumetric flask then add the following: 1.6 g Disodium ethylenediamine tetracetate dihydrate (EDTA), 48.0g Sodium phosphate and 92.0 g Potassium phosphate monobasic.
Fecal coliform bacteria are determined by membrane filtration SM 9222 A, D.
Determined gravimetrically by filtering the liquid samples and drying the retained solids in 104 degrees Celsius oven SM2540 D/97.
Grab samples were collected from different stages of the treatment process in the morning. All the tests were performed immediately after sampling.
To optimize the results, Principle Component Analysis (PCA) was computed using XLSTAT2015.3.01.19349 software. The data in Tables 1 and 2 were used as variables. Correlation matrix was used as the variables were measured in different units.
The Coliform count/100 mL is strongly correlated to Nitrates, Nitrites (correlation factors 0.907 and 0.785 respectively), and less correlated to Total Suspended Solids and Monochloramine. In contrast, it is negatively correlated to Oxidation Reduction Potential (-0.956), and Chlorine residual (-0.023), which means as they increase the Coli form count decreases. According to Yong and Hensley [6], the total Coli form count/100ml is inversely proportional to the Chlorine residual mg/l, and if the chlorine residual is more than 0.8 mg/l, the Coli form count is undetected. From Table 2 Chlorine residual ranged from 5.1 to 7.0 mg/l, and Monochloramines (by PDP titration) ranged from 4.6 to 5.2 mg/l which should take care of all the Coli forms, nonetheless still had hits Figure 1. As the correlation magnitude of Oxidation Reduction Potential gets closer to 1 and higher than Chlorine residual, it validates that the Fecal Count is more correlated to the Oxidation Reduction Potential readings which is more reliable than Chlorine residual.
The Eigen values of the data are given by Scree plot Figure 2 and Table 3, which display that F1 and F2 illustrate 80% of the variation pattern. Fecal count/100 ml, Nitrate and Nitrite are the highest contributors for factor F1. On the other hand, for the factor F2, Monochloramine and Chlorine residual are the major contributors (values in bold). The Eigen values give an extent of the variance accounted by the corresponding Eigen vectors (Table 4) [7].
Table 5 and Figure 3 clarify the relationship between variables and factors. Fecal count, Nitrates, and Nitrites are evidently positively correlated compared to Chlorine residual, Total Suspended Solids, and Monochloramine which are orthogonal to the other variables; Meanwhile, Oxidation Reduction Potential is strongly negatively correlated.
The Biplot of F1and F2 Figure 4, the course of the variable indicates the direction of the change, and its length is equivalent to the rate of the change in this direction. Nitrate, Nitrite, and fecal count change in the same direction and with the same rate; likewise, Chlorine residual and Monochloramine follow the same pattern. The variables close to zero are poorly related to principle component and can be eliminated without affecting the results, e.g. TSS. Contrariwise, ORP and fecal count change in the opposite direction and the same rate.
Fecal count, Nitrate, and Nitrite are influenced by the Oxidation Reduction Potential values under 400 mv. Oxidation Reduction Potential values between 400 and 500 mv result in inorganic Monochloramine being the predominant species which is the strongest disinfectant according to Vectorin et al. [8]. When the Oxidation Reduction Potential was less than 400 mv, as presented in data Tables 1and 2, there were still hits even when the chlorine residual was over 0.8 mg/l Figure 5.
At 722F which is the line for sampling Micro, Oxidation Reduction Potential millivolts was low which might have been caused by the formation of biofilm in the line (Figure 6).

Table 1: The data collected at Northeast Water Reclamation facility for Oxidation Reduction Potential (ORP) in millivolts, Nitrate (NO3 ) and Nitrite (NO2 ) in milligram per liter

Table 2: Total Suspended Solids, Monochloramine, Chlorine residual in milligram per liter and Fecal Coli form Most Probable Number

Table 3: The Correlation matrix (Pearson (n))

Table 4: Eigen vectors Table 4: Eigen vectors

Table 5: Correlations between variables and factors
The College of Agricultural and Environmental Sciences, Georgia [9] found that Oxidation reduction potential (ORP) will decrease if biofilm and/bacteria are present. The Oxidation Reduction Potential is a measure of water oxidation levels in millivolts (mV) and higher levels are normally associated with better bactericidal properties. From the results of this study, the lowest Oxidation Reduction Potential value in chlorine contact chamber effluent 722F was 360 millivolts when the fecal coli form was 2 MPN/100 ml, which leads to lower bactericidal properties. Oppositely, when Oxidation Reduction Potential was at its highest value, 411 millivolts, the fecal coli form was none detected which indicates the formation of biofilm lowers the Oxidation Reduction Potential values.
This short term study shows that Oxidation Reduction Potential measures the net potential from the aqueous system composed of oxidants and reductants. This gives Oxidation Reduction Potential a unique ability to detect the chlorine present at any time is sufficient to meet the demand. Also, maintaining Oxidation Reduction Potential between 400-500 mv is more reliable for monitoring the disinfection process than the chlorine residual conventional methods. Usage of the conventional method as DPD titration might interfere with the organic chloramines in the treated wastewater. The development of Biofilm in the line where 722F was collected caused the Oxidation Reduction Potential millivolts to drop which in term leads to lower the efficacy of the disinfection. Flushing the line for sampling Micro and backwashing the sand filters as well should be done more often to prevent the formation of biofilm, which is one of the sources for organic chloramines.
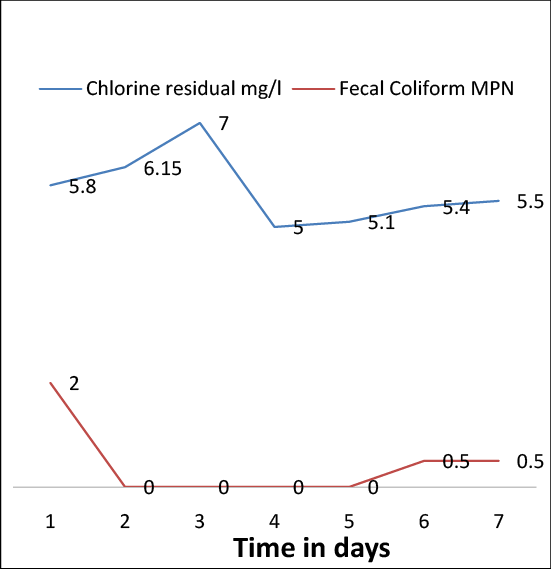
Figure 1: Inffluent Fecal Coliform MPN and Chlorine residual in mg/l at Northeast Water Reclamation Facility
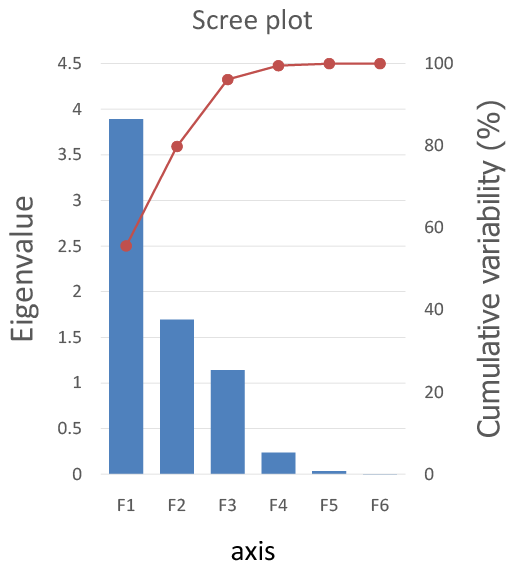
Figure 2: Scree Plot for F1 and F2
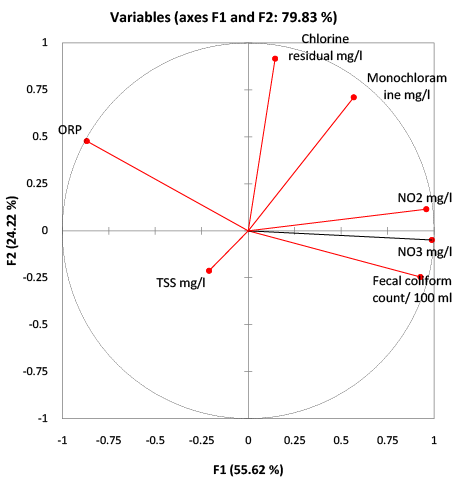
Figure 3: Variables axes F1 and F2
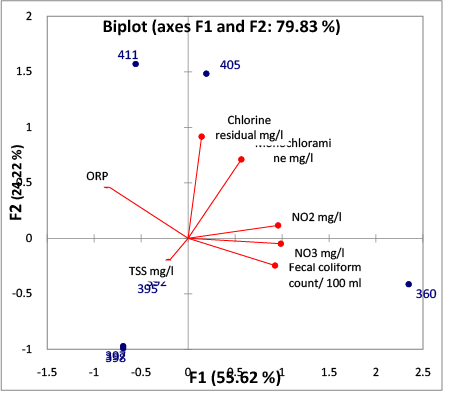
Figure 4: Biplot ( Axes: F1 and F2)
I would like to express my deepest appreciation to all those who provided me the possibility to complete this study. A special gratitude to Craven Askew, Chief operator at NEWRF, for his encourgment .
Furthermore I would like to acknowledge the staff of NEWRF, who gave me the permission to use the required equpiments and materials to compelete the task. A special thanks to Water resources department, city of Saint Petersburg for giving me this opportunity and Mr. Frederick Schipul, Chemist III in ECD, for his comments.
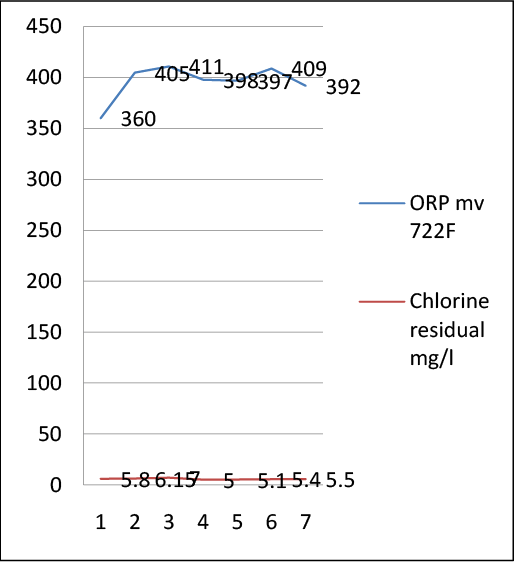
Figure 5: Effluent chlorine residual in mg/l and Oxidation Reduction Potential in mv at Northeast Water Reclamation Facility
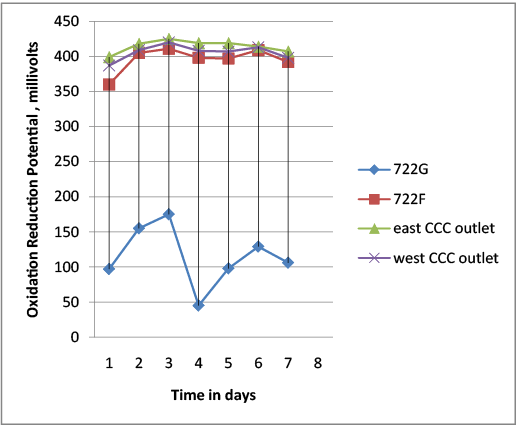
Figure 6: Oxidation-Reduction Potential Millivolts for different sampling points at Northeast Water Reclamation Facility
Download Provisional PDF Here
Aritcle Type: Case Report
Citation: Narouz N (2015) Oxidation Reduction Potential as a Measure of Disinfection Efficacy at North East Water Reclamation Facility, October, 2014. Int J Water Wastewater Treat 1(2): doi http:// dx.doi.org/10.16966/2381-5299.106
Copyright: © 2015 Narouz N. This is an openaccess article distributed under the terms of the Creative Commons Attribution License, which permits unrestricted use, distribution, and reproduction in any medium, provided the original author and source are credited.
Publication history:
All Sci Forschen Journals are Open Access