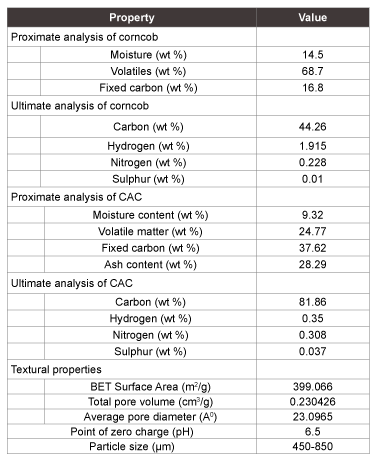
Table 1: Properties of corncob and corncob based activated carbon

Krishan Kishor Garg1* Prashant Rawat1 Basheshwar Prasad1
1Department of Chemical Engineering Indian Institute of Technology Roorkee, Uttarakhand-247667,India.*Corresponding author: KK Garg, Department of Chemical Engineering Indian Institute of Technology Rookie, Uttarakhand-247667, India, Tel: +91- 8979528557; E-mail: kkgarg.garg23@gmail.com
In the present work, hexavalent chromium and COD removal from electroplating wastewater was investigated using a low cost Corncob based activated carbon (CAC). The particle size of CAC was in the range of 450-850 µm. Proximate and ultimate analysis of CAC showed the presence of high carbon content. BET surface area and pore volume were found 399.006 m2 /g and 0.23 cm3 /g respectively. The effect of various parameters such as temperature (T), adsorbent dose (w), pH and contact time (t) on adsorption of chromium ions by CAC was investigated. The optimum pH ≈3.0 is found for the removal of Cr (VI) and COD for optimum dose of CAC (15 Kg/m3 ). Various isotherm models were fitted for Cr (VI) and COD removal. Freundlich model well fitted to Cr (VI) adsorption while Redlich-Peterson is found to be fit for COD removal. Pseudo-second order kinetic model was well fitted for both Cr (VI) and COD removal.
CAC; Adsorption; Chromium; Electroplating; Wastewater
Electroplating industries have potential to generate the effluent consisting of heavy metals like chromium, zinc, copper, cadmium etc. With increasing use of heavy metals in electroplating industry problem may arise of toxicity in environment to a great extent [1-3]. Cost-effective method for purifying the wastewater is highly required. Chrome plating is the most desirable in automobile parts, process equipment etc. for corrosion resistant. Chromium occurs in 1+ to 6+ oxidation states but Cr+1, Cr+2, Cr+4, and Cr+5 are unstable and very less information about their hydrolysis [4-6] .
Species generated by hydrolysis of Cr (III) generally stabilized by electron donor species (e.g. OH- ) while anions produced by hydrolysis of Cr(VI) are hardly stabilized [7-10].
Chromium has beneficial as well as detrimental effect. Cr (III) is an essential element needed for human and other living organism for metabolism [11-15]. It reduces the blood glucose levels and help to transport of amino acids into the heart and liver. It has also been found to decrease blood cholesterol by reducing the concentration lipoproteins in the blood so it reduces the risk of diabetes[16-19].
Many authors have used commercial CAC, Wool, olive cake, sawdust, pine needles, almond shells, cactus leaves and charcoal based CAC, coconut shell based CAC, granulated AC and two samples of fibrous AC, low-cost dolomite adsorbent, activated carbo-aluminosilicate material from oil shale, activated charcoal, low cost adsorbents derived from agricultural waste material, Hevea brasilinesis saw dust activated carbon etc. for removal of Cr (VI) ions from wastewater [20-26]. All type of adsorbents are very costly and difficult to prepare with respect to corncob based AC and process shows high adsorption efficiency of Cr(VI) in compare of other adsorbents.
The Central Pollution Control Board (CPCB), Delhi, India has set a minimal national standard (MINAS) for Cr (VI) as 0.1 mg/l in the industrial discharge into the surface water [27]. In a typical chrome plating plant, high volume wastewater obtained from the washing unit, has high Cr (VI) concentration range of 1000-2000 mg/l. However, low concentration wastewater emanating from the other sections of the range of 50-200 mg/l. Several treatment methods have been developed to remove hexavalent chromium from wastewater. Common methods such as chemical precipitation, membrane separation, ultra filtration, solvent extraction, electro-chemical method, coagulation, ion-exchange [28] and reverse osmosis have been used for the removal of Cr (VI) from waste water. Adsorption is also attractive treatment method for the removal of Cr (VI) from electroplating wastewater [10,29-33].
Due to activated carbon losses during regeneration and high cost of it, researchers are paying attention towards low cost activated carbon mainly derived from agricultural waste for alternative adsorbents. Corncob is a low or negligible cost agricultural waste, derived from corn flour mills. It is generally use for cattle feed and heating purpose, which is not a cost effect use of corncobs. Many researchers have prepared activated carbon from corncob by employing different activation techniques [34,35]. Studies have shown the high characteristics of corncob based activated carbon.
The present study has been reported the preparation and characterization of activated carbon from corncob and to investigate the effect of different parameters such as the pH, adsorbent dose, contact time and initial ion concentration on adsorption process. Kinetics of Cr (VI) adsorption, different isotherms, thermodynamic study and error analysis has also been studied.
The corncobs were collected from Rama agro mill located nearby Roorkee, India. Corncobs were washed several times to take off dirt from it and then cut into small pieces of 0.5-1 cm (after drying in sunlight). Corncobs were carbonized in absence of air in muffle furnace to prepare corncob based activated carbon. Two steps of thermal activation and one step of chemical activation was followed for CAC preparation. Corncobs were heated up to 450 °C for 4 hours to generate pore by removing volatile matters. After carbonization step chars were mixed with sodium hydroxide in glass beaker with ratio (weight) of NaOH/char equal to 3 and impregnated for two hours. NaOH solution helped to remove gas captured within the pore of CAC hence impregnation increased the porosity. Dried impregnated char thermally activated in muffle furnace to 600°C, and kept at this temperature for 2 hours in the absence of air. The resultant carbons were washed several times to take off any chemical attached to CAC. CAC dried at 110°C in a hot air oven for 6 hours. Finally, the dried corncob based activated carbon (CAC) was sieved to get the particle-size ranging from 450 to 850 μm.
Electroplating wastewater samples were acquired from S K udhyog (Automobile part’s electroplating unit) Agra city, U.P. India. Wastewater samples were filtered and stored at 5°C for further use. The characterization of hexavalent chromium bearing wastewater showed the violet-blue colour, 4.5 pH, 1080 mg/l Cr (VI), 1836 mg/l COD, 1443 mg/l TDS, 285 mg/l TSS and 89 mg/l Fe ions.
Chemical oxygen demand (COD) of wastewater samples were measured using UV–visible spectrophotometer (HACH, DR 5000, USA) and digestion unit. Cr (VI) ions dissolved in wastewater sample were measured by flame atomic absorption spectrophotometer (AAS GBC Avanta, Australia) using air–acetylene burner at 425.4 nm wavelength.
The samples were diluted to the suitable concentration range (2-20 mg/l) with distilled water. Whatman filter papers (40 μm) were used for filtration after adsorption. The pH of samples was maintained by adding NaOH or H2 SO4 as per requirement.
Proximate analysis was used to determine moisture content, fixed carbon, volatile matter and ash content of corncob and CAC. Indian standard 1350 part I was used to perform proximate analysis of corncob based activated carbon. Ultimate analysis was used to find out the composition of essential elements (carbon, hydrogen, nitrogen and sulphur). Indian standard 1350 part VI was followed for ultimate analysis [35]. Brunauer-Emmett-Teller (BET) analyzer was used to determine the surface area of corncob based activated carbon (CAC).
The specific surface area of the CAC was investigated by nitrogen adsorption isotherm using an ASAP 2020 micrometric instrument. For the present study, “FE-SEM Quanta 200 FEG, Netherlands” instrument was used to observe the surface texture of the CAC and to get qualitative idea about the morphology and porosity of the CAC. FTIR analysis was performed to find the major functional groups involved in Cr(VI) and COD removal. The CAC sample was mixed with KBr and pellet was prepared. FTIR of CAC was done before and after adsorption. The FTIR spectra were recorded using a Nicolet 6700 FTIR apparatus.
The sample was scanned at resolution between 4000 and 500 cm-1. OMNIC software was used to find out the spectra. TGA analysis was carried out by using “EXSTAR TG/DTA 6300, PerkinElmer, Japan” a Thermo-gravimetric Analyzer with simultaneous measuring of derivatives thermo-gravimetric (DTG), differential thermal analysis (DTA) and thermo-gravimetric (TG) curves. Samples of 10-11 mg were heated from room temperature to 1000°C at the heating rate of 10°C/min under N2 atmosphere. The temperature of decomposition and melting were measured as the temperature of corresponding endothermic maximum point.
To understand the adsorption process point of zero charge of CAC was determined by solid addition method[10,20]. To determine pHPZC, NaNO3 solution of known concentration was prepared by dissolving known amount of sodium nitrate pellets into a 500 ml conical flask. 45 ml of sodium nitrate solution was then transferred into a series of flask (100 ml). The initial pH (pH0 ) of the various flask were roughly adjusted from 2-12 by adding either 0.1N H2 SO4 or sodium hydroxide solution. The initial pH values of each flask were accurately noted. Thereafter one gram of CAC was added to each flask and capped properly. Then flasks were shaken and allowed to equilibrate for 2 days. After 48 h, the final pH of the each solution was noted. The difference between the initial (pH0 ) and final pH (pHf ) values (δpH = pH0 - pHf ) was plotted against the initial pH (pH0 ) values. The point of intersection of the resulting curve at which δpH is zero gave the point of zero charge. This procedure was repeated for different concentrations of NaNO3 [36].
Batch adsorption studies were carried out at different desired pH, for different time, different adsorbent dose and at different temperature to study the effect of various parameters on Cr (VI) and COD removal. First of all, 100 ml of wastewater was taken in the 250 ml of conical flask. Then solution was maintained at desired pH, with desired adsorbent dose and for a definite time in a shaker cum incubator at 150 rpm maintained temperature at 25°C. Wastewater samples were agitated in agitator cum incubator under controlled temperature at a constant speed of 150 rpm at 25 ± 1°C. After a certain time interval samples were withdrawn from shaker. To remove suspended CAC, samples were centrifuged. Thereafter concentration of Cr (VI) and COD was measured by AAS and UV-visible spectrophotometer respectively. The percentage removal of hexavalent chromium was calculated as where Ci is the initial wastewater sample concentration (mg/l), Cf is the final concentration at equilibrium.
$$\% {\rm{ }}Removal{\rm{ }}Cr\left( {VI} \right) = {{Ci - Cf} \over {Ci}} \times 100{\rm{ }} \ldots ..\left( 1 \right)$$Different amounts of adsorbents from 1 g/l to 20 g/l were added to 100 ml of sample. Before adding adsorbent pH of each sample was maintained at the optimum level. After that samples were kept for 2 hours at 25°C in an incubator cum shaker. To understand the temperature effect Temperature was varied from 25°C to 45°C. Kinetic study was carried out at different time intervals (15,30,45,60,120,180,240,300,360,720,1080 and 1440 min) in shaker cum incubator at 25°C while other parameters were kept constant. The adsorption capacity qe (mg/g) was calculated as where V is the volume of wastewater sample (l) and w is weight of adsorbent dose (g).
$$qe(mg/g) = {{(Ci - Cf)v} \over w}.......(2)$$The characteristics of CAC are listed in Table 1. Proximate analysis of CAC showed the moisture, volatiles and fixed carbon percentage. The prepared CAC had high fixed carbon and low moisture content. Ultimate analysis of CAC represents the high carbon (81.86%) and trace amount of sulphur (0.037%). Prepared CAC had high ash percentage (28.29%) than that of raw corncob. The value of point of zero charge obtained at the intersection of the initial pH with the δpH=0 line. Point of zero charge represents the point at which pH of solution neither favours cations nor anions.
Table 1: Properties of corncob and corncob based activated carbon
From the Figure 1, we can say that all concentrations of NaNO3 , the point of zero charge lies at the initial pH value of 6.5. Thermal behavior of CAC is shown in Figure 2 with TG, DTA and DTG curve. Thermal stability of CAC is directly dependent on the decomposition temperature of its various oxides and functional groups. The TG curve for corncob based activated carbon shows that there was no loss in weight at room temperature. At 100°C loss in weight of CAC was 7.77% corresponding to the moisture content. Three different zones were found at different temperature ranges (1st zone- 27 to 200°C, 2nd zone- 200 to 500°C, 3rd zone –500 to 1000°C) for CAC. In first zone loss in weight of corncob is 8.68% due to the loss of bound moisture while other zones did not show appreciable amount of weight loss. Brunauer-Emmett-Teller (BET) method and “ASAP 2020 micrometric instrument” were used to evaluate the surface area of CAC. The micro-pore area of the CAC was 307.55 m2 /g. The pore volume of CAC was 0.23 cm3 /g. The BJH Adsorption and desorption average pore diameter (4V/A) were 31.741 A0 and 29.999 A0 respectively. The BET surface area of CAC was found 399.066 m2 /g.
FTIR of CAC was carried out by scanning it at resolution between 4000 and 500 cm-1 wavelength. From the Figure 3a it is evident that the strong peaks were found between 3500-3000 cm-1 which indicates the presence of O-H and N-H functional groups. O-H stretching vibrations can be seen at 3434.61 cm-1 in blank CAC. The most important Vobrational modes are the C-H stretching around 3000 cm-1. C-H stretching found at 2923.26 cm-1 in blank CAC. The peak at 1569.50 cm-1 was due to the presence of C=C and C=H stretching. Due to stretch of C-N a peak was found at 1061.85 cm-1. The symmetric CH3 vibration occurs at 1390-1370 cm-1. The symmetric CH3 vibration found at 1383.55 cm-1. The new band was found in Figure 3b at 1456.19 cm-1, which show the CH3 asymmetric deformation vibration due to Cr (VI) loading. From spectrum it is clear that oxygen and nitrogen atoms play a leading role in hexavalent chromium and COD removal. Scanning electron micrograph (SEM) showed the morphological characteristics of CAC.
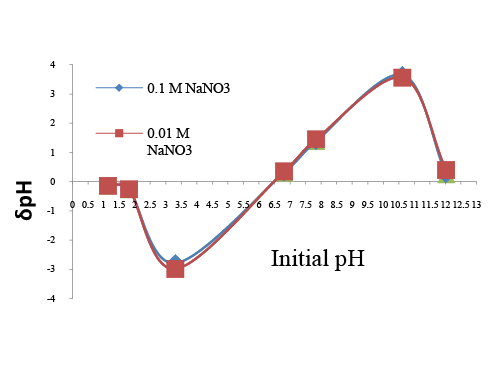
Figure 1: Point of zero charge of CAC
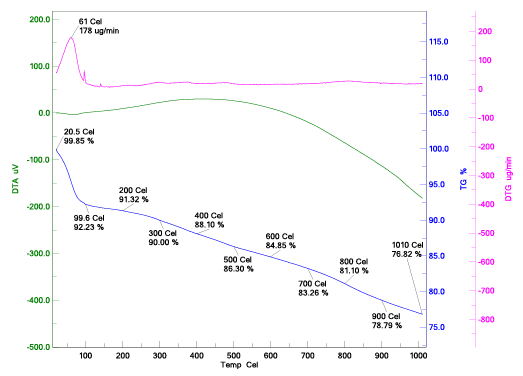
Figure 2: Thermo gravimetric curve (DTA, TGA, DTG)
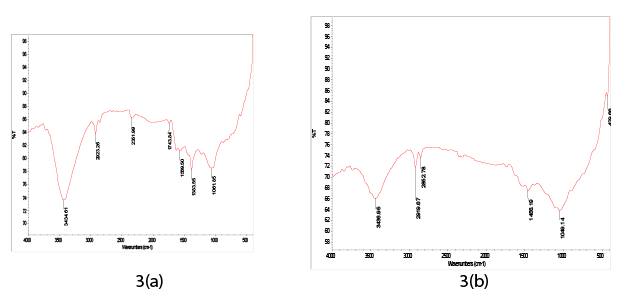
Figure 3: (a) FTIR spectra of blank CAC (b) Cr(VI) loaded CA
The micrographs of CAC before adsorption are shown in the Figure 4a and Figure 4b at different resolution. The SEM micrograph shows porous and irregular surface for CAC which indicate that surface is ideal for adsorptive removal of Cr (VI). Activation with caustic mainly develops pores of large diameter of the order 10 μm. The majority of pores present in CAC are in the category of macro pores. Macro pores are favorable for the removal of metal ions, since it requires large pore structure for penetration of metal ions.
The EDAX analysis of CAC before and after adsorption is shown in Figure 5a and Figure 5b respectively. The EDAX analysis of virgin CAC shows the presence of various elements such as carbon, oxygen, sodium, potassium etc. The EDAX analysis of adsorbed CAC shows the similar pattern but less percentage of oxygen was observed. EDAX analysis after adsorption showed the chromium ions present in the pore of CAC. EDAX analysis of loaded CAC also indicates the presence of sulphur and chlorine adsorbed by CAC.
The pHpzc is the point where adsorbent surface has no charge. At pHpzc point, adsorption process is governed by diffusion of metal ions into micro pore and macro pore alone. At this point electrostatic forces do not play significant role. The experimental value of CAC is found to be 6.5. Hexavalent chromium present in aqueous solution is mainly in the form of chromate (HCrO4 - ) or dichromate ions (Cr2 O7 - ), which is electron-donor group. Hence, at a pH value lower than pHpzc of CAC, the surface of CAC is positively charged attracting chromate (HCrO4 - ) and dichromate ions (Cr2 O7 - ) onto its surface. Hence, we can conclude that acidic solution would be ideal for adsorption onto CAC. The adsorption by CAC was evaluated over a pH range of 2-9 at 25°C for 2 hour at 150 rpm. The adsorbent dose was kept at 10 g/l. The effect of pH is shown in the Figure 6a and Figure 6b respectively. From figure we can justify the theoretical explanation with experimental observation for Cr (VI) and COD removal. For Cr (VI), we observe that as pH is varied from 2 to 9, the removal of Cr (VI) firstly increase to a maximum value at 3 pH and then gradually decrease. Compare to pH value 3, low metal ion removal at 2 pH value was found due to repulsive force caused by the large amount of hydrogen ions. Quite similar result was obtained for COD removal. Optimum pH was obtained as 3 for further experiments [37-40].
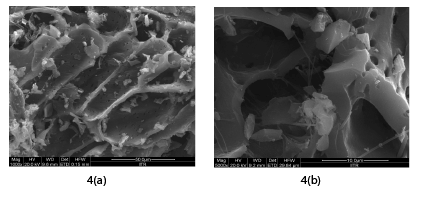
Figure 4: SEM image of CAC at (a) 1000 X (b) at 5000 X
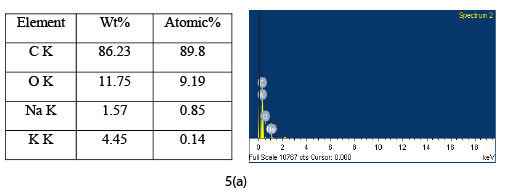
Figure 5a: EDAX of CAC before adsorption
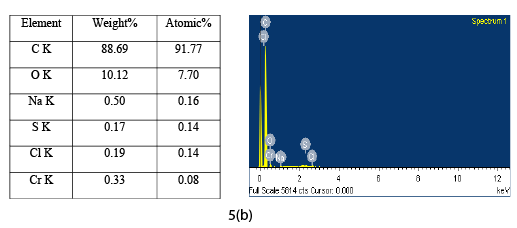
Figure 5b: EDAX of CAC after adsorption
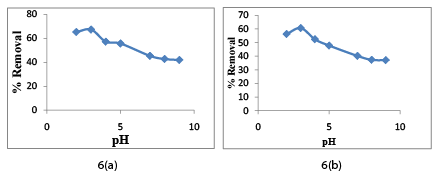
Figure 6: pH effect on (a) Cr (VI) and (b) COD removal
Adsorbent dose effect was estimated by using doses, 1,2,3,4,5,8,10,15 and 20 for Cr (VI) and COD removal. The effect of adsorbent dose on Cr (VI) and COD removal is shown in Figure 7a and 7b respectively. It is found that on increasing CAC dose, the percentage removal for Cr (VI) ions increases gradually up to a certain limit and then it reached a constant value. The Optimum CAC dose for the removal of metal ion is obtained as 15 g/l. The maximum removal Cr (VI) at optimum dose was obtained as 88.28%. Experimental observation can be explained by the fact that on increasing adsorbent dose, the surface area also increases due to the increase in the number of active sites which. This consequently results in more removal of metal ions from wastewater [37-40]. But after a certain limit all the active sites are occupied by the metal adsorbed, hence no more Cr (VI) and COD removal achieved after certain limit (threshold limit). The optimum value of adsorbent dose was estimated at 15 g/l for Cr (VI) and COD removal from the Figure 7a and Figure 7b respectively.
The time at which the adsorption of CAC reaches a saturation limit, this time is termed as equilibrium contact time. At different intervals, the percentage removal of Cr (VI) and COD were examined. The effect of contact time on the removal of Cr (VI) and COD by CAC for m =15 g/l, COD = 122 mg/l and Ci =72 mg/l are shown in Figure 8a and Figure 8b respectively. These figures show the quick adsorption by CAC in the initial small time span, and thereafter, the adsorption rate decreases gradually [37-40]. The residual Cr (VI) concentration was 10% after 180 min, 2.91% after 360 min, 2.82% after 720 min, and 2.75% after 1080 min of contact time. It is experimentally evident that the difference in Cr (VI) and COD removal at 360 min and 1080 min was <0.2% of the 1080 min removal value hence this condition was assumed as steady-state condition and equilibrium condition was accepted as optimum contact time at t=360 min (6h) and further experiments were carried out at t=6h. Contact time for COD removal was also found 6h.
The effect of initial concentration on reduction of Cr (VI) and COD by CAC is shown in following Figure 9a and Figure 9b respectively. From the Figure 9a and Figure 9b, we can conclude that the amount of Cr (VI) and COD removal (adsorption capacity, qe (mg/g)) increases with the increase in initial concentration (Ci ), while percentage of Cr (VI) and COD removal decreased with the increase in initial concentration [37-40].
Adsorption capacity of Cr (VI) and COD removal increased with the increase in initial metal ion concentration due to reduction in the resistance. So we can conclude that adsorption rate increases due to improvement in the driving force. The percentage removal of Cr (VI) and COD by CAC was studied by varying initial concentration from 72-360 mg/l (72,136,216,288, and 360) and keeping other parameters constant. Temperature was also varied (298K, 308K, and 318K) keeping other parameters constant. Higher concentrations of chromium ions and COD values were used to study the maximum adsorption capacity qe (mg/g) of CAC [34]. From the Figure 9a and Figure 9b it is evident that hexavalent chromium and COD removal follows exothermic adsorption process which means on increasing temperature, percentage removal of Cr (VI) decrease. Adsorption process gave maximum percentage removal at 298K.
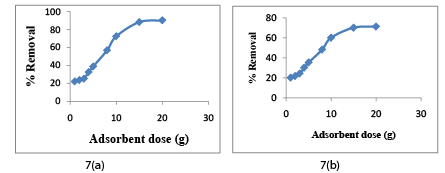
Figure 7: Effect of adsorbent dose on (a) chromium (VI) removal and (b) COD removal
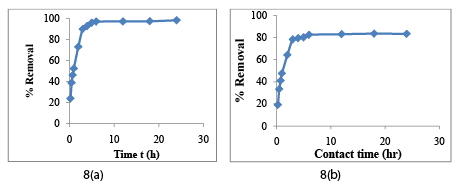
Figure 8: Effect of contact time on (a) Cr (VI) removal and (b) COD removal
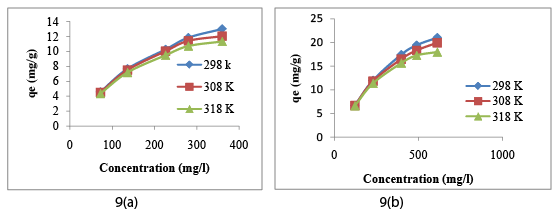
Figure 9: Effect of concentration and temperature on (a) Cr (VI) removal and (b) COD removal
For the purpose of determining the mechanism of adsorption, particularly the potential rate controlling step, the transient behavior of the chromium metal ion adsorption process was analyzed using the pseudo-first order, pseudo-second order, intra-particle diffusion model and Bangham’s equation. The pseudo-first-order equation can be written as: $${{dat} \over {dt}} = k1(qe - qt){\rm{ }}....{\rm{(3)}}$$ where qt is the adsorption capacity (mg/g) at particular time t, k1 is the equilibrium rate constant (time-1) and qe (mg/g) is the adsorption capacity at equilibrium. After definite integration by applying the initial conditions = 0 at t=0 and=at t=t, the Equation 3 becomes: $$\log (qe - qt) = logqe - {{k1} \over {2.303}}t{\rm{ }}....{\rm{(4)}}$$ Value of adsorption rate constant (k1 ) was determined by the plot of log(q q e t − ) vs time. From the slope and the intercept the values of k1 and qe were calculated respectively. Equation for pseudo second-order model can be written as [4] $${{dat} \over {dt}} = k2(qe - qt){\rm{ }}....{\rm{(5)}}$$ Where k2 is pseudo-second-order rate constant [g/(mg) (min)]. The linear form of above Equation 5 can be written as:
$${t \over {qt}} = {1 \over {ksq{e^2}}} + {1 \over {qe}}{\rm{ }}....{\rm{(6)}}$$In many adsorption cases Weber-Morris found that, adsorbate uptakes varies proportionally with t1/2 rather than residence time t.[12] WeberMorris model is used to explain intra-particle diffusion. Diffusion model proposed by Weber-Morris mathematically written as: [5]
$${\rm{qt = kint}}{{\rm{t}}^{1/2}}{\rm{ + 1 }}....{\rm{(7)}}$$where, kint is the intra-particle diffusion rate constant (mg/(g.min)), qt is the adsorption capacity (mg/g) and I is the intercept (mg/g). It is evident that if intra-particle diffusion is the only rate-limiting step in the adsorption process then qt versus t1/2 plot should go through origin. At ideal condition plot of qt versus kint gives a straight line which goes through origin.
Initial concentrations of 72 mg/l and 122 mg/l were used for Cr (VI) and COD removal respectively, while optimized value of pH was kept fixed. The samples were collected at specified intervals till equilibrium was achieved. The experimental data obtained was used to plot the three graphs as per Equations 4, 6 and 7 to evaluate the predictive capabilities of pseudo first order, pseudo second order and intra-particle diffusion respectively. If intra-particle diffusion is the only rate-limiting step in the adsorption mechanism then qt versus t1/2 plot of Equation 7 should go through origin, but in this research work plot does not go through origin because of other diffusion such as film diffusion may also prevailing here. Figure 10a and Figure 10b shows the plot of intra-particle-diffusion model for Cr (VI) and COD removal respectively. The values of kint and I obtained from the plot listed in Table 2.
It is observed that the experimental data do not fit with pseudo first order kinetics properly giving a non-linear plot and low correlation coefficient R2 value as compared to pseudo second order kinetics. The plot obtained from pseudo second order kinetics fitting for Cr (VI) and COD removal are shown in Figure 11a and Figure 11b respectively. Pseudo second order kinetics gave a high correlation coefficient R2 of the order 0.999 for Cr (VI) which indicates that adsorption complies with pseudosecond order kinetics. Adsorption capacity is high for pseudo-second order Model that justifies the best fitting model for hexavalent chromium adsorption. The kinetics parameters for all kinetics models are tabulated in Table 2.
When a solution is agitated with a solid adsorbent, molecules/ ions of adsorbate get shifted from the fluid to the solid phase until the concentration of adsorbate in aqueous solution as well as in the adsorbent are in equilibrium. When equal amounts of solute eventually are being desorbed and adsorbed simultaneously then this is known as adsorption equilibrium. In adsorption process the equilibrium data at constant temperature are illustrated by adsorption isotherm. Isotherm study is important for the design of heterogeneous reactors to purify the wastewater. Many empirical and theoretical models have been proposed to represent the different types of adsorption isotherms. Langmuir, RedlichPeterson (R-P), Freundlich etc. are commonly used isotherm models for reporting the dynamic equilibrium condition. Langmuir isotherm is based on assumption of monolayer adsorption [22]. Numerically Langmuir isotherm equation can be written as
$${\rm{qe = }}{{QmKaCe} \over {1 + KaCe}}{\rm{ }}....{\rm{(8)}}$$Where qe is the adsorption capacity (mg/g) at equilibrium, Qm is the adsorption capacity required for monolayer adsorption, Ce is the equilibrium concentration of solute and KA is the constant related to enthalpy of adsorption. In many instances the heat of adsorption decreases with increasing extent of adsorption process. This decline in heat of adsorption is logarithmic which suggests that the adsorption active pores are distributed exponentially with the heat of adsorption. Such type of behaviour was formulated by Freundlich which does not follow the limit of monolayer adsorption, can be written as:[41]
$${\rm{qe = KFC}}{{\rm{e}}^{1/n}}{\rm{ }}....{\rm{(9)}}$$Where qe is the mass of adsorbate adsorbed per unit mass of adsorbent at equilibrium condition, KF is the Freundlich constant and n is the exponential constant. Redlich-Peterson isotherm was proposed by Redlich and Peterson in 1959 to present combined features Freundlich and Langmuir isotherm [42]. Mathematical form of Redlich-Peterson isotherm can be written as:
$${\rm{qe = }}{{KCe} \over {1 + a{C^b}e}}....{\rm{(10)}}$$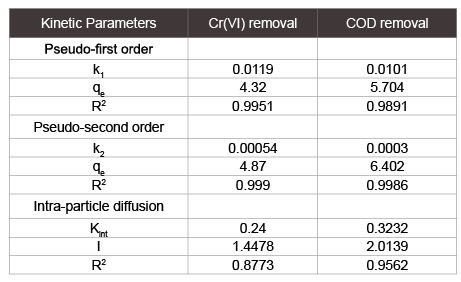
Table 2: Kinetic parameters for the adsorption of electroplating wastewater
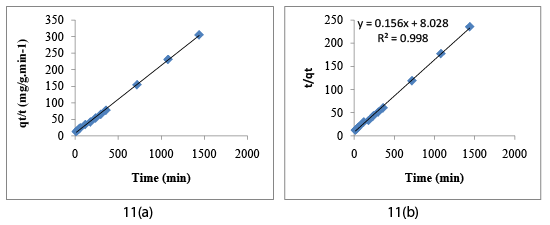
Figure 10 : Intraparticle diffusion for (a) Cr (VI) adsorption on CAC (b) COD removal by CAC
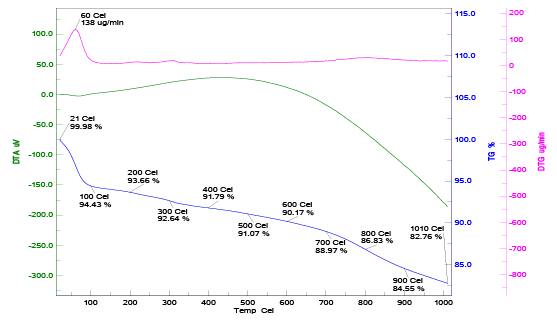
Figure 11: Pseudo-second order plot for adsorption of (a) Cr (VI) on CAC (b) for COD removal by CAC
Where K is the equilibrium constant, a and b are the Redlich-Peterson constants. Sips isotherm model incorporates the Langmuir and Freundlich isotherm model to predict the heterogeneous nature of the process. Sips model converts into Freundlich model at low solute concentration while reduces to Langmuir at high solute concentration. Sips isotherm model equation can be written as:
$$qe = {{{q^s}ma{c^n}e} \over {1 + a{C^n}e}}......(11)$$Koble-Corrigan adsorption models also a three parameter model. Equilibrium condition is representing by both Freundlich and Langmuir model. The isotherm constants of Sips and Koble-Corrigan isotherm model was determined by trial and error method with error minimization technique in the Microsoft excel sheet. The equilibrium constants derived from above isotherm models for Cr (VI) and COD removal are listed in Table 3. Constants listed in Table 3 indicate that experimental data were fitted well for Freundlich isotherm for Cr (VI) removal while Langmuir isotherm model for COD removal.
Where kads is the equilibrium constant, R is the universal gas constant (R=8.314 J mol-1 K-1) and T is the absolute temperature (Kelvin). The Gibbs free
Energy (∆G) also related to the heat of adsorption (∆H0 ) and entropy change (∆S0 ) at constant temperature, which may be written as:
$$\Delta {G^0}ads = \Delta {H^0} - T\Delta {S^0}.......(12)$$The previous two relations give the equation:
$$1nKads = {{\Delta {G^0}ads} \over {RT}} = {{\Delta {s^0}} \over R} - {{\Delta {H^0}} \over R}{1 \over T}.....(13)$$Thermodynamic parameters such as Gibbs free energy change ∆G0 (kJ/mol) generally estimated using classical Vant’s Hoff equation at different temperatures (298K, 308K, 318K, and 328K):
$$\Delta {G^0}ads = - RT{\rm{ }}1n{\rm{ }}Kads.....(14)$$Where ∆HM0 (kJ.mol-1) is enthalpy change and ∆S0 (kJ mol-1 K-1) is the change in entropy. Thus ∆H0 and ∆S0 can be determined by the slope and intercept of linear Vant’s Hoff plot (lnKads versus (1/T)) respectively. Experimental data were determined at various temperatures (298K,308K,318K) with the help of different isotherms (e.g. Freundlich, Redlich-Peterson, Sips, Koble-corrigan and toth), enthalpy, entropy and Gibb’s free energy were determined. For our experimental data thermodynamic parameters show the exothermic and spontaneous nature of adsorption process which indicates that adsorption process is favoured at low temperature. Negative values of enthalpy (Table 4) insure the exothermic nature of adsorption. Adsorption process showed complex mechanism because it is neither fully chemical sorption process nor fully physical process. Negative value of ∆G0 indicates the decrease in Gibbs energy and feasibility and spontaneity of adsorption process.
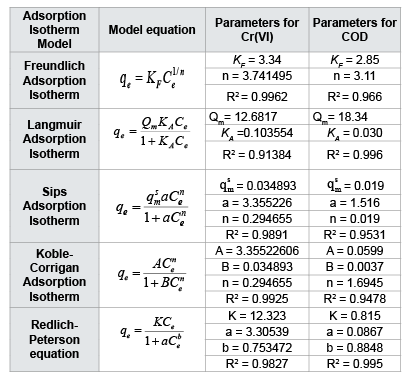
Table 3: Adsorption equilibrium isotherm constants for hexavalent chromium and COD
Linearization of isotherm model biased the actual equilibrium data fitting. Different error functions were used to investigate the best-fit isotherm model to experimental equilibrium data.
The sum of the squares of the error (SSE)
The SSE equations can we written as:
$$SSE = \sum\limits_{}^{} {{{(qe,\exp - qe,cal)}^2}} ......(15)$$Where qe,exp is the adsorption capacity (mg/g, experimentally) in the solid phase, qe,cal is the calculated adsorption capacity by isotherm model. This is a widely used method for error estimation but SSE provides a better-fit at higher end of liquid phase concentration range. This can explain by the fact that as solution concentration increase the magnitude of square of errors also increase [43,44].
RMSE is a better estimation of accuracy. The RMSE equation is given as:
$$RMSE = \sqrt {{{\sum {(qe,\exp - qe,cal)} } \over N}} ......(16)$$where N is the number of data points in the experimental run. It provides the measurement of difference between predict value and experimental values.
The SEP is the standard deviation of differences between the predicted and reference values for a set of samples. The formula of SEP is given below.
$$SEP = {{RMSE} \over {\sum {(qe,\exp /N)} }} \times 100......(17)$$Normalized standard deviation (NSD) The calculation of NSD can be achieved by using following formula:
$$NSD = \sqrt {{{\sum {{{[(qe,\exp - qe,cal)/qe,\exp ]}^2}} } \over N}} \times 100.......(18)$$Normalized deviation (ND)
The formula for the calculation of ND is given below:
$$ND = \sum {} \left| {{{(qe,\exp - qe,cal)} \over {qe,\exp }}} \right| \times {{100} \over N}.......(19)$$Values of different error functions are listed in Table 5. The results for best-fit are obtained by comparing all error function which has been described above for hexavalent chromium and COD. Numerical values of statistical indices indicate the Freundlich isotherm model best-fit model for chromium removal. The best-fit prediction by R2 (non-linear) represented the same result for Cr (VI) by CAC. A contradictory result was obtained in the case of COD by CAC. Best-fit prediction by R2 (nonlinear) for COD was Langmuir isotherm model while error functions represent the Freundlich isotherm model best-fit for COD removal by CAC.
After adsorption pores of adsorbent fill by pollutant contained in wastewater and it is not reliable for further use. In present study loaded adsorbent has some chromium ions attached to its pores; hence proper disposal technique should be applied. Recycling of loaded CAC may be possible by chemically or thermally regeneration method but it is less feasible because of its high cost. The oxidation behaviour of loaded CAC was investigated by thermogravimetry instrument in oxidizing environment. The thermal degradation of loaded CAC was shown by differential thermal analysis (DTA), thermal gravimetric analysis (TGA) and differential thermal gravimetric (DTG) analysis. The curves of DTG, TGA and DTA are shown in Figure 12.
The TG curve shows 5.57% loss of moisture and volatile matter evolution from 200°C to 500°C for loaded CAC. CAC was activated at 600°C; hence it showed very low weight loss up to that temperature. The weight loss about 9.03% was found between 400°C to 1010°C for loaded CAC. Loaded CAC showed total weight loss of about 17.24%. Heating value of blank CAC was estimated at 22.36 MJ/Kg. Loaded CAC may be dried and further can be used for heating purpose. Ash may be used to make fire bricks or may blend with cement mixture [31].
Adsorptive removal of hexavalent chromium and COD from electroplating wastewater by corncob based activated carbon was found effective. The characterization of CAC was carried out by different standard methods. Result obtained from characterization suggests that the prepared CAC has a well-defined pore with majority of macro pores, gave advantage for present study. BET surface area was found to be 399.006 m2 /g. Some kinetic models were appropriate for the present experimental data. Pseudo-second order model followed best fit in comparison of pseudofirst order and intra-particle diffusion model. The adsorption of Cr (VI) and removal of COD found high dependent on solution pH, contact time, Adsorbent dose and temperature. In the present study, percentage removal decreases with increase in pH value and removal increases with increase in adsorbent dose. The adsorption of chromium ions and COD removal were observed maximum at pH of 3, and 15 g/l of adsorbent dose. The maximum removal efficiency of chromium ions and COD were found to be 95.27% and 82.28% respectively. CAC prepared by low cost agricultural waste showed good potential for chromium ion and COD removal. Corncobs are easily available in any part of India at negligible cost, which makes it the potential raw material for preparation of activated carbon. Since the removal efficiencies of Cr (VI) and COD removal are satisfactory, it is concluded that CAC is an effective and efficient alternative adsorbent for hexavalent chromium and COD removal from electroplating waste water.
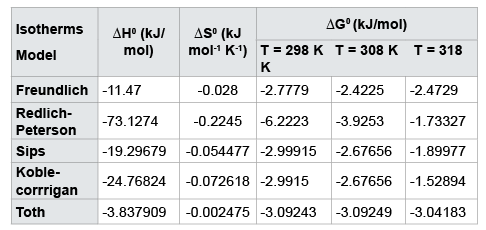
Table 4: Thermodynamic parameters of various isotherm models for Cr (VI) removal
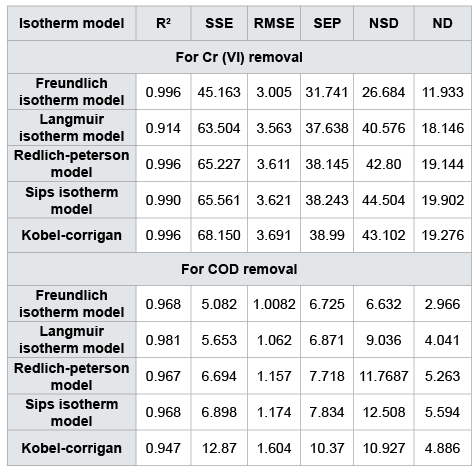
Table 5: Statistical indices for chromium (VI) and COD removal
Download Provisional PDF Here
Aritcle Type: Research Article
Citation: Garg KK, Rawat P, Prasad B (2015) Removal of Cr (VI) and COD from Electroplating Wastewater by Corncob Based Activated Carbon. Int J Water and Waste Water Treatment 1(1): doi http://dx.doi.org/10.16966/2381-5299.102
Copyright: © 2015, Garg KK, et al. This is an open-access article distributed under the terms of the Creative Commons Attribution License, which permits unrestricted use, distribution, and reproduction in any medium, provided the original author and source are credited.
Publication history:
All Sci Forschen Journals are Open Access