
Figure 1: Process configuration of the pilot-scale treatment line (RAS DeOx is the return activated sludge deoxygenation)


Christian Baresel1* Klara Westling1 Oscar Samuelsson1 Sofia Andersson1 Hugo Royen1 Sofia Andersson2 Niklas Dahlén2
1 IVL Swedish Environmental Research Institute AB, Valhallavägen 81, 100 31 Stockholm, Sweden*Corresponding author: Christian Baresel, IVL Swedish Environmental Research Institute AB, Valhallavägen 81, 100 31 Stockholm, Sweden, E-mail: christian.baresel@ivl.se
The Membrane Bioreactor (MBR) technology is evaluated concerning central municipal sewage treatment aspects including nutrient removal, removal of micropollutants (MP) and emissions of greenhouse gases (GHG). Pilot-scale experiments in preparation for the world largest MBR process in Stockholm, Sweden show that
Membrane Bioreactor; Sewage treatment; Nutrient removal; Ultrafiltration; Greenhouse gas emissions; Emerging pollutant; Micropollutants; Pharmaceutical residues; Ozonation; Activated carbon; Microplastics
Several municipal wastewater treatment plants (WWTPs) in Stockholm, Sweden, will within the near future face both an increased load due to a growing population as well as more stringent effluent quality requirements. The latter mainly regarding nutrients due to Sweden‘s commitment to the Baltic Sea Action Plan and the implementation of the European water framework directive (WFD). In addition, removal of emerging substances such as pharmaceutical residues, micro plastics and antibiotic resistance are gaining more attention since WWTP effluent is the most or one of the most significant sources of such loads to the environment [1-4]. Pharmaceutical residues and other emerging substances are generally not efficiently removed in conventional WWTPs [5]. The WFD has defined a list of prioritized substances including pesticides, biocides, flameretardants and metals [6], which already today require monitoring and treatment. Several other substances, including some pharmaceuticals, are on the ‘watch list’ of emerging pollutants that may be placed on the WFD priority list. Requirements for additional treatment, in larger WWTPs, for the reduction of some pharmaceutical residues and other micropollutants (MP) could thus be expected, also in other countries than Switzerland, where such a regulation is already in place. The potential negative effects on aquatic organisms, the aquatic food-web and higher organisms, as well as the risk of increased numbers of antibiotic resistant genes in bacteria, all present a threat to our environment, health and society [7-9]. Another increasing concern for wastewater treatment are emissions of greenhouse gases (GHGs). At WWTPs, special attention is given to nitrous oxide (N2O), which is a highly potent GHG (298 times more potent than carbon dioxide (CO2 ) [10]). At incomplete nitrification and denitrification N2O can be emitted, which may cause a significant negative overall environmental impact of the treatment process [11,12]. Even though regulations may earliest come in place in some years from now, many WWTPs actively work on reducing GHG emissions from wastewater treatment processes. Besides the requirements to increase capacity, improve treatment efficiency and reduce GHG emissions, many WWTPs also face the problem that they cannot expand spatially as they are located in densely populated areas or underground.
New solutions for space-efficient, high-capacity and flexible municipal wastewater treatment processes are thus required. Stockholm Water and Waste Company (Stockholm Vatten och Avfall), Sweden’s largest water service organization, is directly facing the above problems of space limitation, increased capacity need and stricter effluent requirements at the Henriksdal WWTP in Stockholm. As a result, the existing conventional activated sludge process (CAS) will be converted to a Membrane Bioreactor (MBR), doubling the capacity by using existing process volumes only. The new process will be the world’s largest MBR facility with a capacity of 1.6 million PE (predicted load year 2040).
MBRs combine the biological activated sludge process with membrane separation, which provide distinct advantages over the CAS. Advantages include a significantly better effluent (permeate) quality regarding particles, disinfection capabilities due to the membrane pore size, higher volumetric loading due to higher sludge concentrations in the biology, reduced footprint and process flexibility towards influent changes. Even the treatment of MP may be more efficient using MBRs compared to traditional treatment systems. This is partly explained by the fact that MP attached to particles can effectively be removed by filtration whereas dissolved MP can be degraded more effectively because of the higher biological activity in a MBR process. In addition, a more efficient polishing treatment compared to CAS can be achieved [11,13-18]. Drawbacks of the process are the high energy use for aeration and the use of cleaning chemicals in the filtration step to curb fouling and scaling on the membrane surface, which reduces the permeability of the membranes.
MBRs have been used for a number of decades but only in the last decade, MBRs gained more attention for the treatment of both municipal and industrial wastewater. This is mainly due to a significant cost reduction of membranes and process development decreasing energy requirements [19-23].
The aim of this research work is to investigate the MBR technology concerning the overall holism and resource efficiency towards some of the most central treatment aspects including nutrient removal, removal of micropollutants and minimizing of GHG emissions. Through actual pilotscale experiments, the paper describes the performance of the studied system under various test periods defined to meet present and future requirements of the growing region of Stockholm, Sweden.
IVL Swedish Environmental Research Institute and Stockholm Water and Waste Company have together setup and since September 2013 operated a pilot-scale treatment line with a capacity corresponding to 0.015% of the total Henriksdal WWTP facility (design year 2040). The pilot-scale treatment line (Figure 1) was constructed as a copy of the future treatment line at Henriksdal WWTP and located at the R&D facility Hammarby Sjöstadsverk (www.hammarbysjostadsverk.se, part of the Swedish Water Innovation Center in Stockholm).

Figure 1: Process configuration of the pilot-scale treatment line (RAS DeOx is the return activated sludge deoxygenation)
The influent to the pilot is taken from the untreated inflow to the Henriksdal WWTP and filtered through a 3 mm strainer. The flow into the pilot is proportional to the flow to the main WWTP. The pilot consists of an aerated pre-precipitation tank, a primary clarifier, a biological reactor with a total volume of about 29m3 that is divided into anoxic and aerobic zones, followed by an ultra-filtration (UF) tank of 13.2m3 . Nitrate is recirculated from the beginning of the post-denitrification zone to the beginning of the pre-denitrification zone, and sludge is recirculated from the UF tank to the beginning of the pre-denitrification zone. A separate de-aeration tank aiming to reduce the oxygen concentration in the return sludge by nitrification/respiration is further used (RAS DeOx). Supernatant from sludge dewatering is continuously added to this step. The ultrafiltration consists of two modules with Flat Sheet membrane type MFM 100 from Alfa Laval (Denmark). The UF units are operated intermittently with relaxation times of 2 minutes after 10 minutes of operation. The nominal pore size is 0.2 microns with a minimum and maximum pore size of 0.17 microns and 0.26 microns, respectively. The total membrane area per module is 79.64m2 spread over 44 membrane sheets.
The TransMembrane Pressure (TMP) control strategy was applied for membrane operation. When the permeability decreased about 30% from its initial value, cleaning of the membranes (Clean-In-Place, CIP) was performed according to supplier requirements. Sodium hypochlorite was used for removal of organic coatings and oxalic acid for the removal of inorganic coatings.
Sampling varied during the pilot study depending on evaluation focus. However, daily and weekly composite samples were collected in the inflow, after the primary clarifier and in the effluent. Grab samples were collected in the biological reactors and the UF tank. Standard parameters analyzed included total organic carbon (TOC), biological oxygen demand after 7 days (BOD7 ), total phosphorous (TP), phosphate-phosphorous (PO4-P), suspended solids (SS), volatile suspended solids (VSS), total dissolved solids (TDS), ammonium-nitrogen (NH4 -N), nitrate-nitrogen (NO3 -N), nitrite-nitrogen (NO2 -N), total nitrogen (TN), digested iron (Fe), digested P in sludge and temperature (T). Online measurements for PO4-P, NO3 -N, NH4 -N, dissolved oxygen (DO), SS, pH, redox, water and air flow, temperature, pressure and water level were used at several locations in the pilot for both process monitoring and control.
During the first year of operation (Oct 2013-Aug 2014), the study focus was to reach targeted effluent concentrations of nitrogen (6 mg TN/L) and phosphorus (0.2 mg TP/L) at different loading and dosing conditions divided into four different test periods (P1-P4, see Table 1). During the second year of operation (Sep 2014-Nov 2015), a larger focus was given to optimizing the overall treatment efficiency of the system and specifically the phosphorous removal. The test periods of the second year (P5-P17) were based on different control strategies for dosing of precipitation chemical. During P1-P9, Sodium Acetate (NaOAc) was used as external carbon source for post-denitrification. From test period P10 and onwards, the proprietary blend Brenntaplus was used. Table 1 below and Table S1 in the supporting information provide detailed information about the test periods.
| Test period (P) | Week/ Year | Flow 1 | Organic load | Flux | Sludge content | Dosing Carbon2 | Dosing P-removal | |
| Amount | Location3 | |||||||
| [m3/h] | [m3/h] | [L/(m2·h)] | [mg/L] | COD [mg/L] | [mg/L] | [-] | ||
| Startup (S) | 40-49/13 | ◄──────── Seeding and biology establishment ────────► | ||||||
| P1 | 50/13-13/14 | 2.5 (C) | 3.2 | 15.7 | 3500-6000 | 5-15 | 6-12 FeSO4 | 1Q |
| P2 | 14-21/14 | 2.5 (D) | 3.2 | 15.7 | 4500-6000 | 15 | 12 FeSO4 | 1Q |
| P3 | 22-27/14 | 4.3 (D) | 5.5 | 27.0 | 8000 | 30 | 20 FeSO4 | 1Q |
| P4 | 28-36/14 | 2.75 (D) | 3.5 | 17.2 | 6000 | - | 15 FeSO4 5FeCl3 | 1F 1Q |
| P5 | 39-44/14 | 2.8 (D) | 3.6 | 18.1 | 5000 | - | 20 FeCl 3 | 1Q |
| P6 | 45-50/14 | 2.8 (D) | 3.6 | 16.0 | 5000 | 50 | 30 FeSO4 | 1F |
| P7 | 51/14-03/15 | 2.8 (D) | 3.6 | 16.2 | 5000 | 45 | 20 FeSO4 | 4Q |
| P8 | 04-09/15 | 2.8 (D) | 3.6 | 17.8 | 5500 | 55 | 12 FeSO4 | 1 & 3Q |
| P9 | 10-13/15 | 2.8 (D) | 3.6 | 15.1 | 5500 | 65 | 10 FeSO4 18 FeCl 3 |
1Q 3Q |
| P10 | 14-15/15 | 2.8 (D) | 3.6 | 16.5 | 5500 | 80 | 10 FeSO4 5 FeCl 4 |
2Q 3Q |
| P11 | 16-18/15 | 2.8 (D) | 3.6 | 12.3 | 5000 | - | 9 FeSO4 11 FeCl 3 |
1Q 3P |
| P12 | 19-23/15 | 2.8 (D) | 3.6 | 17.5 | 5500 | 55 | 15 FeSO4 | 2F |
| P13 | 24-30/15 | 2.8 (D) | 3.6 | 15.4 | 6500 | 30 | 11 FeSO4 4 FeCl3 |
2F 3P |
| P14 | 31-33/15 | 2.8 (D) | 3.6 | 12.5 | 5500 | 8 | 14 FeSO4 | 2F & 3P |
| P154 | 34-36/15 | 3.2 (D) | 4.0 | 13.7 | 5500 | 55 | 10 FeSO4 | 1F |
| P16 | 37-38/15 | 3.2 (D) | 4.0 | 18.4 | 5500 | 60 | 8 FeSO4 | 1F & 2P |
| P17 | 39-45/15 | 3.2 (D) | 4.0 | 18.0 | 5500 | - | 18 FeSO4 1 FeCl 3 |
1F & 2P 3P |
| 1 – C - constant flow, D - dynamic flow, controlled by flow signal to full-scale WWTP Henriksdal 2 – Between S - P9, NaOAc was used, between P10 - P17 Brenntaplus 3 – see Figure 1 for location, F = fixed dose, Q = flow proportional, P = proportional to effluent phosphorus concentration 4 – Tank modification of the RAS/DeOx allowed for a higher load |
||||||||
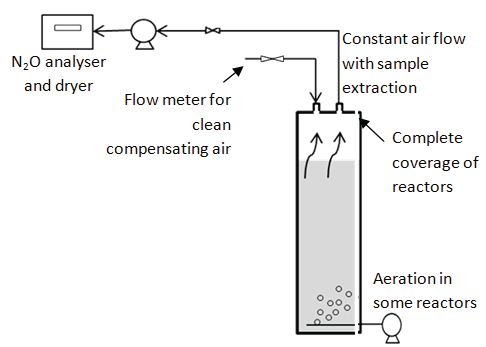
To investigate N2O emissions from the MBR process, two screening campaigns of the various process steps including primary clarifier, biological reactors and UF tank were conducted; the first without and the second with addition of reject water from sludge dewatering to the RAS DeOx. The pilot was operated with the same conditions under both campaigns (test period P13). Each reactor was covered and all process off gas was measured and analyzed by Teledyne analytical instrument (Model GFC-7002E). Figure S1 in the supporting information provides a general schematic of the screening setup. Total nitrogen (TN), ammonium (NH4 -N) and nitrate (NO3 -N) were analyzed on the spot at the start and end of the measurement period for each reactor. Total emissions were calculated using measured airflow and concentrations in the off gas.
The pilot study included investigation of the removal efficiency of various micropollutants in the MBR process with or without the following complementary polishing steps (i) ozonation and (ii) BAF(GAC), a biological active filter with granulated active carbon. Ozonation tests were performed during a series of test days with sampling after three retention times at each configuration change. BAF(GAC) tests were carried out during 20 months with weekly composite sampling. Some of the daily composite samples for process operation of the pilot were collected during various periods during one year for analyses of microplastics. Investigated micropollutants include a wide range of relevant pharmaceuticals and other emerging substances, estrogen effect, bacteria, and microplastics (see Table S1 for details about investigated substances). Standards analytical methods have been applied for all analyses [24] except for microplastics that were analyzed according to a method described by Magnusson et al. [25]. The supporting information provides more details including a schematic layout of the pilot setup for the ozonation and BAF(GAC) tests.
The pilot study included a number of other activities related to the overall treatment performance of MBR process. This included mapping of the sludge microflora in the UF tank and comparison with the conventional active sludge process in the full-scale Henriksdal WWTP using the MiDAS protocol [26,27]. Further, a simulation model of the MBR-pilot based on the activated sludge Model No. 1, ASM1 [28] was established and used to test and evaluate various operational changes before implementation.
The results show that the process configuration was capable to meet targeted removal requirements for both nitrogen and phosphorus (Figures 2 and 3). Due to various tests plans, load cases but also occasional disruptions in the operation, the reduction as presented in the Figures was not below desired target levels 100% of the time. Average effluent concentrations were 4.2 mg TN/L and 1.42 mg TP/L for year 2013, 4.1 mg TN/L and 0.24 mg TP/L for year 2014 and 4.6 mg TN/L and 0.26 mg TP/L for year 2015.
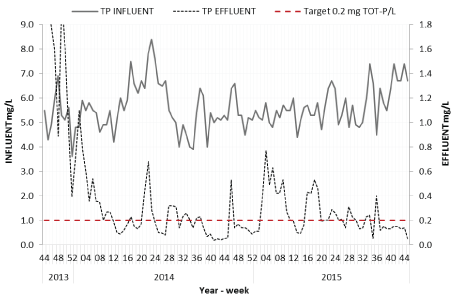
Figure 2: Phosphorous concentrations in the influent and effluent during the whole project period
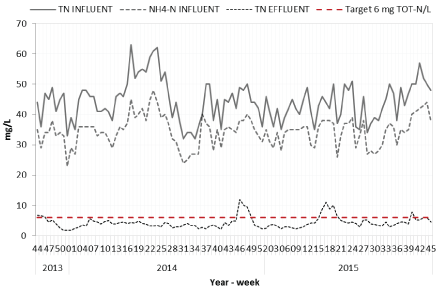
Figure 3: Nitrogen concentrations in the influent and effluent during the whole project period
Between weeks 44-49/2013, no precipitation chemical was added with elevated TP-effluent concentrations as a result. Addition of precipitation chemical started with low doses and the dose was successively increased until satisfactory effluent concentrations were reached. Increased TPeffluent concentrations between weeks 03-09/2013 were due to trials with low chemical dosage.
Addition of reject water to the treatment line was started from week 46/2014 and caused an approximately 10% increase in the total nitrogen load and temporally increased effluent concentrations. Influent samples were collected prior to reject side-stream addition. After week 49/2014, adjustment in the carbon dosing control to consider the addition nitrogen load caused by the reject water achieved again lower effluent concentrations. Increased effluent concentrations during weeks 15- 21/2015 were due to trials with no addition of carbon source.
Figure 4 shows that 14 cleaning of membranes (CIP) were carried out during the whole project period, which represents significantly shorter time intervals than during standard MBR process operation where about two CIPs per year are common for operations based on producer recommendations (AlfaLaval). This is mainly explained by the fact that the operation of the pilot-MBR experienced harsher conditions than a full-scale municipal MBR would have. This includes for instance periods of high dosing of precipitation chemical and dosing directly in the UF tank. In addition, to evaluate the different test periods, CIPs were applied to restore the membrane permeability as much as possible each time before starting a new test period.
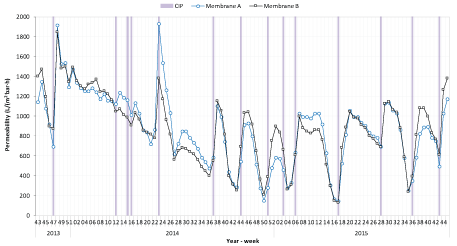
Figure 4: Membrane permeability during the whole project period. Cleaning of membranes (CIP) is marked by grey lines. Due to changes in the CIP procedure, throughout the project duration, the permeability has not reached desired levels at all CIP events.
The N2O emission screening showed highest emissions from the first aerated zone, which is explained by the high nitrogen load and stripping of dissolved N2O. Emissions were also high in the second aerated zone and the aerated UF tank, but as nitrogen loads were lower in these reactors compared to the first aerated zone, total emissions were also lower. Anoxic zones did not show any significant emissions except for the first zone of the biological treatment and the primary clarifier. However, N2O might still be produced in these zones but if so, it was then mainly stripped out in aerated zones. Emissions were significantly higher both as a total and in each individual zone when reject water from sludge dewatering was added to the treatment process, compared to when no reject water was added.
In total about 0.02% and 0.09% of the total nitrogen load to the pilot was emitted as N2O without and with reject water addition, respectively. This is significantly lower than emissions from a CAS pilot line of similar size at the R&D-facility and several full-scale nitrogen removing WWTPs in the Stockholm region that were measured to emit between 0.13-1.2% of the influent nitrogen as N2O [29]. It is also lower than internationally reported N2O emissions varying between 0.8% and 6.5% [30-32]. An explanation for these low emissions compared to conventional process configuration remains yet to be determined and for this reason, new measuring campaigns are planned. However, the increased biological activity in the MBR process compared to the other studied systems may be responsible to some part for the lower emissions.
The MBR process provides a high-quality, particle-free effluent compared to traditional activated sludge processes. Bacteria, including multiresistant bacteria, of all sizes larger than the membrane pore size are efficiently removed from the wastewater by the MBR process. However, very low concentrations (<65 cfu/100 mL) of bacteria were still detected in the MBR effluent but it could not be determined if these bacteria originated from sample contamination or contact of the permeate with the atmosphere. Both aspects are almost impossible to avoid in sewage treatment environments. Not a single microplastic particle was detected in the MBR effluent (removal efficiency 100%), whereas effluent water from the full-scale CAS process including a final sand filtration contained both plastic fibres and plastic fragments (removal efficiency 90.7%). Nonsynthetic fibers were found in both MBR and CAS effluents.
Analyses of pharmaceutical residues in the MBR effluent showed similar levels as in the full-scale CAS effluent (except for amlodipine and sertraline that were reduced to a somewhat higher extent in the MBR process). This indicated no increased removal effect of pharmaceuticals by the MBR process compared to the CAS process as suggested in other studies [14,16].
The complementary treatment of MBR effluent with ozonation or a biological active filter has been evaluated for the same substances and estrogen effect (see Table S1 in the supporting information). All investigated substances could be removed by more than 90% over the complementary treatment step only. In addition, the studied phenolic compounds triclosan and bisphenol A were reduced to below the detection limit by both technologies. Most nonylphenol was removed as well by both ozonation and BAF(GAC), while only the BAF(GAC) worked well for octylphenol. Total coliforms in the treated MBR effluent were reduced with about 80% by ozonation and >85% by the BAF(GAC). Interestingly, fecal coliform removal was absent in the BAF(GAC) during the first weeks of operation while a reduction of more than 90% was achieved after 3 months of operation. This might be explained by the establishment of a biology in the filter that outcompetes fecal coliforms. Ozonation could only reduce fecal coliforms at higher ozone doses of >9 gO3/m3 .
Compared to similar complimentary treatment of CAS effluent (i.e. the same influent water, see e.g. Baresel et al. [33] and Ek et al. [34]), lower ozone doses were required to achieve a high reduction of persistent substances during ozonation, and a significant reduction of clogging and backwash frequency was achieved in the BAF(GAC) when treating MBR effluent. Both aspects have a direct impact on the operational cost of the advanced treatment of effluents. Both aspects are also related to the higher quality of MBR effluent compared to traditional CAS effluent, even with sand filtration. The long-term evaluation (2 years) of the biological filter is still ongoing and the final evaluation remains to be done. However, the filter capacity was maintained even after 20 000 Empty bed volumes without the need of GAC replacements. The removal efficiencies of ozonation and BAF(GAC) were also compared with reverse osmosis (RO) which was performed in parallel experiments at the R&D-facility. More details are provided by Baresel et al. [13].
The microbial population composition and dynamics in activated sludge from the MBR process was significantly different compared to the full-scale CAS process at Henriksdal WWTP [35]. The mapping showed that it might be a useful tool to understand process changes and for operation control in the future.
Model simulations showed a decrease in carbon source consumption and overall improvement of nitrogen removal if the nitrate recirculation was moved to a location earlier in the post-denitrification (before the dosing point for external carbon). Based on the simulation results the pilot operation was changed.
The evaluation of the MBR process shows that targeted effluent qualities of <0.2 mg TP/L and <6 mg TN/L could be achieved under various loads. However, this may require relatively high precipitation chemical and external carbon doses at maximum load conditions.
The tested membranes showed a high average permeability and complete removal of particles throughout the whole test period. The UF- membranes showed increased fouling at high doses of precipitation chemicals, especially if the dosing point was near to or in the UF tank. A precipitation chemical dosage control strategy based on the effluent phosphate concentration was identified as favorable to achieve stable low phosphorus concentrations in the effluent without risking excessive fouling of the membranes.
The results further indicate that the studied MBR process had a lower direct GHG impact than other traditional treatment processes as the observed amount of nitrous oxide emissions were lower than what has been reported for CAS processes.
The MBR process provides an efficient removal of microplastics and bacteria due to the integrated UF. A complementary treatment of the MBR effluent by ozonation or biological active filter with activated carbon as filter material can provide an effective removal of pharmaceutical residues and other micropollutants with less effort than efforts compared to comparable treatment of CAS effluent.
In general, the project results show that the MBR process provides a flexibility to meet various demands for efficient sewage treatment to low effluent concentrations of organics, nutrients, suspended solids and micropollutants. The advanced biological process configuration in combination with an effective membrane separation as the main treatment process produces a high-quality effluent that can effectively be upgraded by additional polishing steps.
The project is still on-going, investigating a number of issues including increased treatment and resource efficiency, reduced use of chemicals and energy and comparison between the flat-sheet membranes used in this study and hollow-fibre membranes. The formation and potential problems of chlorinated organic contaminants (measured as AOX (Adsorbable Organic Halides) and EOX (Extractable Organic Halides)) and other environmental impacts of membranes operation and cleaning will be investigated.
A longer nitrous oxide emissions measurement campaign is planned to further investigate the positive results presented here. This campaign will also include N2O in the water phase with a novel online probe [36] in order to quantify the N2O production and consumption dynamics.
Further, more tests with resource-efficient removal of micropollutants and a holistic integration of various complementary treatment steps into the MBR process will be investigated. This includes, for example, tailormade enzyme filters for polishing of the MBR effluent.
The findings from the mapping of the microbiological population indicate that the properties of the MBR sludge differ from the CAS sludge, which may affect the sludge handling, i.e. thickening, dewatering and digestion. To establish if such conclusions can be drawn, the sludge handling will be investigated in pilot-scale and linked to the microbial population composition in further studies.
| No. | Substance | Pharmaceutical/ Characteristics | No. | Substance | Pharmaceutical/Characteristics |
| 1 | Amlodipine | Antihypertensive | 22 | Naproxen | Anti-inflammatories |
| 2 | Atenolol | Antihypertensive | 23 | Norethindron | Hormones |
| 3 | Bisoprolol | Antihypertensive | 24 | Norfloxacin | Antibiotics |
| 4 | Caffeine | Stimuli | 25 | Oxazepam | Sedatives |
| 5 | Carbamazepine | Sedatives | 26 | Paracetamol | Anti-inflammatories |
| 6 | Ciprofloxacin | Antibiotics | 27 | Progesterone | Hormones |
| 7 | Citalopram | Antidepressants | 28 | Propranolol | Antihypertensive |
| 8 | Diclofenac | Anti-inflammatories | 29 | Ramipril | Antihypertensive |
| 9 | Doxycycline | Antibiotics | 30 | Ranitidine | Histamine-2 blocker |
| 10 | Enalapril | Diuretica | 31 | Sertraline | Antidepressants |
| 11 | Estradiol | Hormones | 32 | Simvastatin | Cholesterol-lowering |
| 12 | Estriol | Hormones | 33 | Sulfamethoxazole | Antibiotics |
| 13 | Estrone | Hormones | 34 | Terbutaline | Asthma medicine |
| 14 | Etinylestradiol | Hormones | 35 | Tetracycline | Antibiotics |
| 15 | Finasteride | Prostate | 36 | Trimethoprim | Antibiotics |
| 16 | Furosemide | Diuretica | 37 | Warfarin | Anticoagulant |
| 17 | Hydrochlorothiazide | Antihypertensive | 38 | Microplastics | Size: 20 – 300 μm; >300 μm |
| 18 | Ibuprofen | Anti-inflammatories | 39 | Estrogen effect | Yeast Estrogen Screen (YES) |
| 19 | Ketoconazole | Antifungal | 40 | Phenolic compounds | Bisfenol A, triclosan, nonylfenol, oktylfenol, etc. |
| 20 | Ketoprofen | Anti-inflammatories | 41 | Bacteria, Pathogens | Total and fecal coliforms |
| 21 | Metoprolol | Antihypertensive |
Table S1: Investigated micropollutants and effects.
The BAF(GAC) was tested in a pilot filter (diameter 62 cm) with automatic backwash when the filter bed started to clog (control level was set to 45 cm above the coal bed). The filter consisted of a 10 cm thick gravel/sand bed at the bottom and a 1 m layer of commercial granulated carbon (Filtrasorb 400, Chemviron Carbon, density ~ 0.5 kg/L). The contact time in the bed (EBCT) was about 14 minutes, which was based on earlier tests with various effluents [1,2]. The water passed through the filter was collected in an equalization tank for backwash. Backwash consisted of a sequence of pulses of pressurized air to terminate any pressed layers and backwash with water from the equalization tank.
Offgas emissions
Figure S1: General setup of the off-gas measurements in the various reactors
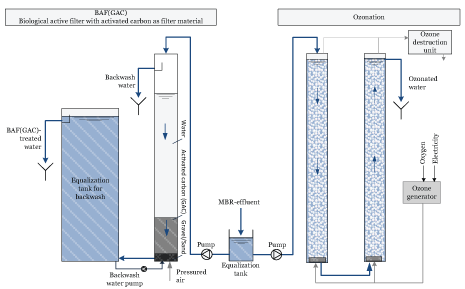
Figure S2: Schematic illustration of the pilot setup with tests for ozonation and BAF(GAC) - biological active filter with activated carbon as filter material Ozonation was tested at doses between 3 and 13 g O3 / m3 at a DOC of 10 mg/L using a Wedeco unit (Modular HC8) with oxygen production from air (pressure swing method), an ozone generator, a reactor and a degassing chamber. The ozone generator capacity was 8 g ozone/h (16 g ozone/m3 or 1.2 g ozone/g TOC at an average residence time of 20 minutes). The reaction vessels consisted of two columns in series with upstream flow, where ozone was added via a diffuser at the bottom. Each column had a volume of 115 liters and a height of 4.2 meters. Degassing was accomplished via a simple overflow with air extractors. In some experiments, only the second column was used at a flow of 700 L/h, which gave a residence time (HRT) of about 10 minutes in the column. At the highest dose, 13 g of ozone/m3 , the flow was reduced to 550 L/h for the production of ozone through the ozone generator would suffice. The contact time then became 13.6 minutes.
Download Provisional PDF Here
Article Type: Research Article
Citation: Baresel C, Westling K, Samuelsson O, Andersson S, Royen H, et al. (2017) Membrane Bioreactor Processes to Meet Todays and Future Municipal Sewage Treatment Requirements? Int J Water Wastewater Treat 3(2): doi http://dx.doi. org/10.16966/2381-5299.140
Copyright: © 2017 Baresel C, et al. This is an open-access article distributed under the terms of the Creative Commons Attribution License, which permits unrestricted use, distribution, and reproduction in any medium, provided the original author and source are credited.
Publication history:
All Sci Forschen Journals are Open Access