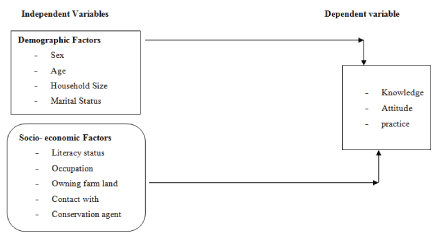
Figure 1: Conceptual Framework of the Study (Researcher, 2015).

Abrham Kefale Gelaw1 Sisay Misganaw Tamiru2*
1Public policy and Sustainable Development Program, University of Gondar, Gondar, Ethiopia*Corresponding author: Sisay Misganaw Tamiru, Department of Development and Environmental Management Studies, University of Gondar, Gondar, Ethiopia, Tel: +251911888625; E-mail: sisymis27@gmail.com
Even though forests are among the precious natural resources of the world, they are degraded from time to time at an alarming rate in many countries, including Ethiopia. Thus, this study was intended to explore community natural forest resource dependency and its causes of degradation in Dembiya woreda, using questionnaire, key informant interview, focus group discussion and analyzed using SPSS software. It was obtained as agriculture was the life of the sample household heads in the study kebeles and most others were engaged in selling of forest products (i.e., fuel wood and charcoal) so as to earn income for their livelihood. Some of the survey respondents didn’t rely on the forest resource in the area. The forest resources that are close to settlements are usually more degraded than those far away. Respondents replied that Dembiya woreda natural forest is the main source of fodder for rearing animals. Even their relationship and dependency on community forestry has been largely determined by the size and number of their livestock holdings. Many of the respondents argue as there was forest cover loss in the study area. The survey results also showed that the respondents identified decline of forest products, disappearance of wild animals and soil erosion respectively as sign of forest destruction in the study area. In line with this, many of the respondents agreed that fire wood collection was the major cause of forest degradation in the study area. On the other hand, the respondents identified expansion of agricultural land and population growth, demand for charcoal making, livestock raring, lack of community awareness, inadequate forest legislation, cutting trees for house construction and unintentional bush firing were the causes of forest degradation respectively.
Natural forest; Community; Livelihood; Forest degradation; Deforestation
Utilization and management of environmental resources like Natural forests are bases for development [1]. According to FAO [2], Ethiopia loses about 141,000 hectares of forest per year. The main agents of deforestation in Ethiopia include agricultural expansion, inappropriate land-use patterns, overgrazing, consumption of firewood and charcoal, fodder collection and forest fire. Besides these, poverty and rapid population growth are also the main causes of forest depletion [3].
In Amhara region, the forest resources are estimated to cover about 5.91% of the total area of the region. These forest resources included densely forested (0.48% of the total area or 81,047 ha), woodland (4.2% of the total area or 716,915 ha), plantation forests (1.23% of the total area or 209,799 ha). These forest resources are administered under three forms of ownership: state, private and community [4,5]. According to Woreta A [5], the main challenges of forests facing in the region are poor community participation, lack of sustainability in forest resource development and utilization, lack of appropriate technology for forestry development and utilization, high deforestation rate due to illegal logging and encroachment.
From the many causes of deforestation some are expansion of farm land, logging and fuel wood, overgrazing and infrastructure, poverty, land rights and inequitable land distribution, poor planning system and lack of political will [6].
This study was conducted to assess community natural forest resource dependency and its causes of degradation in Dembiya woreda because the problem was expected to be huge in this study area. Therefore, this research would help to have clear ideas for conducting management options and utilization mechanisms of the natural forest resource in the study area.
Conceptual framework shows that the knowledge, attitude and practice of forest dependent community towards forest management. The three major dependent variables that constitute the conceptual framework for this study are knowledge, attitude and practice of the community towards sustainable forest development was outlined by the researcher and expected to have dependent and independent relationships that would be analyzed and confirmed by the result. These dependent variables are affected by different demographic and socio-economic factors. The demographic factors include sex, age, marital status and family size of the respondents. There are also certain socio-economic variables which have strong relation with knowledge, attitude and practice towards forest. Such variables are education, occupation, land ownership and contact challenges of community forest. In the conceptual frame work the arrow reveals the impact of the dependent variables on the independent variables. Each dependent variable was expected affecting the independent variable positively or negatively. Figure 1 shows the relationship found between dependent variables and independent variables.
Figure 1: Conceptual Framework of the Study (Researcher, 2015).
Dembiya woreda is one of the weredas in North Gondar Administration zone, located between Lat 12°31’56.33’’ N, Long 36°07’31.83’’ E and bordered in the south by Lake Tana, in the southwest by Takusa wereda, in the west by Chilga wereda, in the north by Lay Armachiho wereda and in the east by Gondar Zuria woreda (Figure 2) [7].
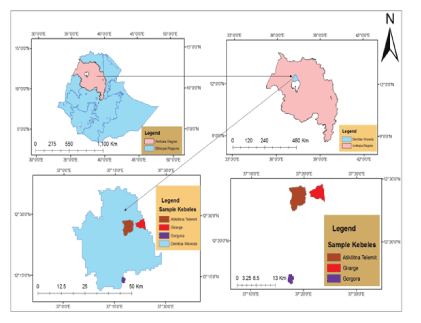
Figure 2: Map of the study area (Ethio GIS, 2007).
The wereda has 40 rural and 5 urban kebeles (Koladiba, Aymiba, Chuahit, Gorgora and Robit). More than 10 kebeles have wetlands along the shore of Lake Tana. The natural vegetation consists of acacia trees, hardwoods such as wild fig (warka), Cordia Africana (wanza) as well as the introduced eucalyptus trees planted by farmers and others. Agriculture is the dominant sector of the economy in the study area [7].
Based on the 2007 national census conducted by the Central Statistical Agency of Ethiopia (CSA), this wereda has a total population of 316,917 of whom 159,219 were women and men 157,698. The total area of the wereda is 1295.930 square kilometers (km2) [8] (Figure 2).
This research was carried out on natural forest resource management gaps to assess community natural forest resource dependency and its causes of degradation in Dembiya woreda. This would help to have clear ideas for forest management in the area. This study employed both qualitative and quantitative research approaches so as to collect relevant information and data. Accordingly, the qualitative approach uses soft data (description) whereas the quantitative approach uses hard data (numbers) for its purpose.
Both primary and secondary sources of data were used for this study. Primary data was collected through household survey, focus group discussion and key informant interview. Secondary sources were employed to support the primary information which included published and unpublished materials i.e., books, journals, projects, working papers, previous studies and reports, and official documents. While collecting the data, all precautions to ensure the data reliability were taken. First hand data were collected from wereda administration officials, wereda rural and agricultural development personnel, local Development Agents (DA’s), community leaders and households living adjacent to forest resource in the three sample kebeles of the woreda (Atekelt teleft, Gerargie and Gorgora).
According to Central Statistics Agency [8], the total number of the population in the wereda was 316,917. The population taken as a reference in this research work was the household heads in three rural kebeles of Dembiya woreda which are found within the inclusion criteria of ages of 18 years and above.
The wereda comprises of forty five kebeles; out of 45 kebeles, only three kebeles (namely, Gorgora, Gerargia and Atekelt teleft) were selected based on the degree of proximity (i.e., close to the natural forest resources). Other 42 kebeles are situated far away from the forest resource. For this reason, they were not selected for this study. The three sample kebeles adjacent to the forest comprises of 10,830 populations, out of which 2183 were household heads. Out of the 2183 households, 182 households were selected from the three kebeles as a sample for this study through simple random sampling technique by using Yamane’s proportion allocation formula as shown in section.
Sample population determination: Sample size of the study was determined depending on the nature of the study, cost, time, and cooperation of involved participants of the study. Since the population is a finite, application of statistical formula becomes imperative in determining the sample size to this study. There are several approaches to determine a sample size. Among these, Yamane (1967) as cited by Tewodros W [9] provides a simplified and easy formula to calculate the required sample sizes at 95% confidence level with the maximum degree of variability and the desired level of precision of 3%, 5%, 7% and 10% other than others. Thus, this study employed the desired level of precision, i.e., =7% due to the homogeneous nature of the population and the big size of the total households found in each kebele.
Therefore, the formula;
\[n = \frac{N}{{1 + N\left( {{e^2}} \right)}}\]
was employed for this study to determine sample size.
Where ‘N’ is the total population for the study, ‘n’ is sample size and ‘e’ is tolerable error or desired level of precision, which is 7% or 0.07.
By using this formula, the desired total sample size for this study was:
\[n = \frac{{2183}}{{1 + 2183{{\left( {0.07} \right)}^2}}} = \frac{{2183}}{{11.697}} = \frac{{2183}}{{12}} = 181.92 = 182\]
Sampling techniques: The three kebeles sample size was determined by using Yamane’s proportional allocation formula: n1=N1, where n1 is 1+N (e)2 the respondents being selected in each kebele, N1 is number of household heads in each kebele, N is the total household heads and ‘e’ is the level of precision or reliability, the sample size of each kebele was calculated in the following manner:
For example, from Atekelt teleft kebele, the desired sample size was calculated as:
\[N = \frac{{773}}{{1 + 2183{{\left( {0.07} \right)}^2}}} = \frac{{773}}{{11.697}} = \frac{{773}}{{12}} = 64.42 \approx 64\]
Hence, 64 sample households were taken for Atekelt teleft kebele for this study. The same formula holds true for the remaining two kebeles. By using this proportion allocation sampling technique, 61 and 57 sample households were selected from Gerargie kebele and Gorgora kebeles respectively. Finally, simple random sampling technique (i.e., the lottery method) was employed in order to select HH from the three kebele, because this technique gives every member of the population equal chances of being selected. Therefore, a total of 182 household respondents from three selected kebeles were considered to be representative of the study population. Table 1 displays the summary of total population and households (HHs), total sample size that were randomly selected for response in this study (Table 1).
| No. | List of kebeles | Total population | Total HHs per kebeles | Sample HHs from each kebele | ||||
| Male | Female | Total | Male | Female | Total | |||
| 1 | Atekelt teleft | 1974 | 1921 | 3895 | 773 | 48 | 16 | 64 |
| 2 | Gerargie | 1752 | 1760 | 3512 | 726 | 35 | 26 | 61 |
| 3 | Gorgora | 1669 | 1754 | 3423 | 684 | 43 | 14 | 57 |
| Total | 5395 | 5435 | 10,830 | 2183 | 126 | 56 | 182 | |
Table 1: Total households and sample house hold respondents.
Source: Dembiya Wereda communication office [7].
Transect walk and direct observation: Transect walks and observation is the highly effective and supportive technique in the qualitative research methodology [10]. These techniques involve a regular visit to the surroundings of the community under study. Three transect walks (i.e., walking through the forest) was undertaken, two with the community members and one with local development agent in the selected areas of the forest. The journey took over 1 hr travel to approach respondents in different distant kebeles, especially Atekelt teleft kebele respondents. Hence, a walking tour through areas of interest was conducted to observe different conditions, to ask questions and to identify problems. Therefore, village walk and informal talk with key villagers and officials were important tools used for data collection in this study. The nature, current status of the forest and its geographical location, biological diversity found within the forest especially Gorgora (e.g. types of trees and wild animals, fauna and flora etc.), the extent of forest lands cleared for farming or other purposes, people who were cutting trees in the forest for different purposes as well as some causes for community forest resources depletion were also directly observed.
Key informant interviews were employed with relevant community elders, community development committee members, Kebele chairpersons, Local development agents (DAs), Wereda Rural and Agricultural Officers and Wereda Administration Officer. Therefore, a total of six key informants were purposively selected and interviewed. Key informants were guided by a checklist of questions.
Focused Group Discussions (FGDs): Focused group discussions (FGDs) were carried out with the household heads and guided by guiding questions. Gender difference was considered in focus group discussion in order to get relevant information from both sexes. A total of three FGDs with small groups of people, 8 persons each from the sampled household heads and key informants were held in an informal and relaxed atmosphere. They were asked to discuss issues relating to factual information on the past forest status, the current situations of deforestation in the study area, their knowledge on causes, challenges and the level of community participation in forest management.
FGDs provide access to large body of knowledge about the community [11] and yet are cheaper and quicker to conduct than individual interviews. Furthermore, it is also helpful to understand the issue of local forest management and the household level of participation in the forest management. Hence, the focus group discussions encouraged dialogue among respondents. By controlling the direction of the discussion, the researcher was able to gather a wide range of information and varied viewpoints. The respondents also generate and shared information one another, recall, verify or rectify items of information.
Data analysis involves a number of closely related operations which are performed with the purpose of summarizing the collected data and organizing these in such a manner that they answer the research question(s) or objectives.
The data was analyzed by SPSS and excel software [12]. The quantitative data were analyzed using simple descriptive techniques such as frequencies and percentages. Data collected through openended items, responses of key informant interviewees, personal observation and focus group discussion were considered during data analysis. The analyzed data were presented in the form of tables, cross-tabulations, charts, figures and plates. Some graphs and charts were produced using Micro-soft excel application software. In addition, information that was retrieved from secondary sources was qualitatively analyzed and discussed along with the primary data.
One of the most important human capitals is the level of education attained by the heads of the household. Education is the foundation for development. It is believed to have shaping human mind towards goodness and aware of the users about the socio-political, cultural, economic and environmental problems and prospects. Hence, the survey respondents were asked to indicate the level of education they attained. In this study, the levels of education of the respondents were categorized into seven structured parts: who can’t read and write, first cycle primary school (Grade 1-4), second cycle primary school (Grade 5-8), first cycle secondary school level (Grade 9-10), second cycle secondary school level (Grade 11-12) or Preparatory school, Diploma and university level (Table 2).
| Educational level | Frequency | Percent (%) |
| Can’t read and write | 120 | 65.9 |
| Primary School first cycle (Grade 1-4) | 32 | 17.6 |
| Primary School second cycle (Grade 5-8) | 15 | 8.2 |
| Secondary School first cycle (Grade 9-10) | 10 | 5.5 |
| Secondary School 2nd cycle (Grade 11-12) | 2 | 1.1 |
| Diploma or TVET college level | 2 | 1.1 |
| University level | 1 | 0.5 |
| Total | 182 | 100 |
Table 2: Percentage distribution of the respondents by educational level.
Source: Field survey, 2015.
From the table 2, it is clear that out of the total 182 respondents, 34.1% (n=62) percent of the survey respondents were able to read and write because they attended formal education while the remaining 65.9% (n=120) percent of the respondents were not able to read and write. Thus, a considerable number of the respondents were who can’t read and write. Hence, the level of awareness on forest resource conservation is limited.
According to the information obtained from the key informant interview held within the wereda natural resource conservation officer, people who were not able to read and write were not interested to participate in forest resource management (Key informant interview, 2015). A total of 25.8% of the respondents have attended both Grade 1-4 and Grade 5-8 primary level of education, while only 6.6% of the respondents had joined secondary education. Respondents who completed diploma training and university level accounted 1.6% from the sampled respondents. Thus, the least percentage was observed among people who have attended tertiary/higher education level (Table 2). This confirmed that as educational level is very essential in forest resource utilization and conservation.
The result of table 3 revealed that out of the total 182 sample household heads, the majority (96.81% or 158) of the respondents followed Ethiopian Orthodox Christianity at the time of the survey. While 3.3% (n=6) of the total sample size constituted the Protestant Christianity, the remaining 9.4% (n=17) and 0.55% (n=1 were Muslims and other religion followers, respectively.
| Religion | Frequency | Percent(%) |
| Orthodox Christian | 158 | 86.81 |
| Protestant | 6 | 3.3 |
| Muslim | 17 | 9.34 |
| Others | 1 | 0.55 |
| Total | 182 | 100 |
Table 3: Distribution of respondents by religious background.
Source: Field survey, 2015.
The finding of this study revealed that the Orthodox Christianity religion dominated the study area. Most orthodox Christianity churches are covered by indigenous trees and other plant species. The local communities were protecting these tree species from outside attack. No one is going to cut these trees from the churches because it is believed that the trees are sacred, honorable and cutting them from the churches is religiously prohibited and the almighty God will punish the doer. Therefore, religion has its own influence on conservation of forest resources in the study area (Table 3).
Average household size and gender of the respondents: The average household size in the study area is approximately five people per household (Table 4).
| Gender | Household size | Total | ||
| More than five | ||||
| Male | 67 (53.2%) | 59 (46.8%) | 126 (100%) | |
| Female | 23 (41.1%) | 33 (58.9%) | 56 (100%) | |
| Total | 90 (49.5%) | 92 (50.5%) | 182 (100%) | |
Table 4: A Cross-tabulation of the average household size by gender
of the respondents.
Source: Field survey, 2015.
Based on table 4, out of the total 126 male and 56 female household heads, it was found that 53.2% of male and 41.1% of female household respondents had less than or equal to five family size. On the contrary, about 46.8 percent of male and 58.9 percent of female respondents had the family size of more than five per home. In general, 49.5 percent (n=90) of the survey respondents had less than or equal to five household size and the remaining 50.5 percent (n=92) had more than five family size in the study area. This implied that approximately both genders had similar size of family members in the study area. The focus group discussion held with community forest development committee indicated that the interaction of the community members with the forest resource protection and use increases as average household size increases because peoples who were living with the household that possessed more family members had an opportunity to have more labor than those who had relatively lower family members. This implies that household heads with large family members have a greater demand for forest products such as firewood collection and other activities due to their free labor as compared to the household heads with small family size that were unable to participate actively due to work load specially during harvesting time. This result is in line with Adhikari U [13] that households with large family size have labor time to devote to the activities of forest resource utilization. Moreover, the findings in IYF [14] with regard to family size indicated that the influence of household size on the level of forest utilization is positive, consistent and significant. They added that as family size increases, the probability of being high level utilization increases by 15.6%.
Average farm land size: Out of the total 182 survey respondents, 61.5% (n=112) of the household heads had average farm land size of less than 1 ha. While 15.9% (n=29) of the respondents had average farm land size between 1-1.5 ha, 13.7% (n=25) and 8.8% (n=16) had an average farm land size of 1.5-2 ha and more than 2 ha respectively. The result showed that in all three kebeles, most of the respondents had farm land size of less than 1ha as indicated in figure 3. However, the majority of the respondents (n=46) who had an average farm land size of less than 1 ha came from Gorgora kebele. As compared to its counter kebeles, majority of Atekelt teleft kebele community respondents had an average farm land size of 1-1.5 ha. The same number of respondents (n=6 each) from both Atekelt teleft kebele and Gerargie kebele community respondents had the same average farm land size of above 2 ha when compared to Gorgora kebele survey respondents (Figure 3). Thus, the scarcity of the land would lead the local farmers to expand their farm land size into the nearby forests.
Hence, farm land size of the respondents has significant impact on the participation level of the local people in forest management for sustainable uses. This is because the smaller the farm land size, the more people would encroach into the forest reserve to meet their varied need for their livelihood. Especially, those peoples’ who had an average farm land size of less than 1 ha might expand their farm land to increase the size and to produce more crops for their livelihood purpose. Consequently, the farmland expansion could influence the sustainability of the forest resource in the area. This result resembles with Bisrat W [15] study. In his study on “the impact of resettlement on the livelihood of settler population’’, he indicated that out of 247 (58.53%) sample household heads, 54.1% of the respondents expanded their farm land to the nearby forests at the expense of forest cover and the remaining 4.43% expanded to pasture or grazing lands (Figure 3).
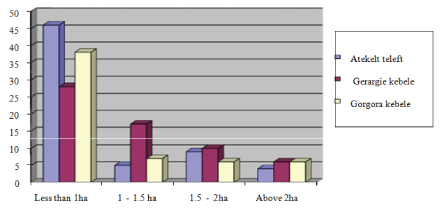
Figure 3: Shows the frequency distribution of respondents by their farm land size in the study kebeles.
The main sources of income for livelihood: Agriculture is the backbone of the Ethiopian economy. It plays a leading role in the country’s overall economic development. Accordingly, it is the base of livelihoods for the people residing in the Dembiya woreda. The main economic means of the people in the study area is crop production and animal rearing with the higher reliance on the former. From the total sample household heads, the majority (58.2%) of the respondents’ main source of income was crop production and livestock rearing (Table 5).
| Main sources of income | Frequency | Percent(%) |
| Crop production and livestock rearing | 106 | 58.2 |
| Government salary and farming | 10 | 5.5 |
| Livestock rearing only | 14 | 7.7 |
| Selling of fuel-wood and charcoal | 31 | 17 |
| Petty trade | 21 | 11.5 |
| Total | 182 | 100 |
Table 5: Percentage distribution of household respondents by main
source of income.
Source: Field survey, 2015.
As it was learned from the key informant interview with model farmers, agriculture was the life of the sample household heads in the study kebeles (Key informant interview, 2015). Of the total respondents were engaged in selling of forest products (i.e., fuel wood and charcoal) so as to earn income for their livelihood. Focus group discussion held with the household respondents indicates that those who are engaged in this activity brought the wood from open access forest, not from their own plantation.
A Cross-tabulation of community dependence on Dembiya woreda forest resource versus distance from the forest boundary: Distance from the forest is one of several factors that influence the extent to which a household depends on a forest resource. This study would mainly dictate whether a household depend fully on forest or not for its needs. This implies that these communities have high chance of interaction with the forest resources than those communities who were located far away. Furthermore, it was also possible to those very adjacent communities to extract the types of the forest products easily. Only 26.3%, 13% and 3% were found around a distance of 4-6 km, 6-8 km and 8-10 km consecutively. These local communities who had found within these radiuses had less impact to interact with the forest products, such as fuel-wood collection, as compared to those who were found within the radius of 2 to 4 km. However, a total of 45 (24.7%) survey respondents didn’t rely on the forest resource in the area (Table 6).
| The distance of the survey respondents home from the forest resource boundary | Community dependence on Dembiya wereda natural forest resource | Total | |
| Yes | No | ||
| 2 to 4 Km | 79 (57.7%) | 0 (0.0%) | 79 (43.4%) |
| 4 to 6 Km | 36 (26.3%) | 9 (20%) | 45 (24.7%) |
| 6 to 8 Km | 18 (13%) | 16 (35.6%) | 34 (18.7%) |
| 8 to 10 Km | 4 (3%) | 20 (44.4%) | 24 (13.2%) |
| Total | 137 (100%) | 45 (100) | 182 (100) |
Table 6: A Cross-tabulation on the distance of the forest boundary versus
community dependence on Dembiya wereda natural forest resource.
Source: Field survey, 2015.
The forest resources that are close to settlements are usually more degraded than those far away. This may be because the settlement members derive most of their subsistence from the forest. The cost of travelling to a distant forest to collect daily provisions for the household may be high if the forest is not in a walking distance. However, where people have no choice, they still walk long distances in order to get the forest products. This study result indicates that the more the walking distance, the less likely the household heads depend on the forest resources. This shows that people who are living close to the forest resource would depend more on it than those far away. This implies that those people who are living nearby the forest resource would rely more on it and more likely extract the forest products than those who are far away from it. Therefore, the household level of participation was even influenced by the distance from the forest boundary in this study. As distance from forest boundary increases, the level of forest resource will decrease. This result has resembled with Engida TG and Mengistu AT [16] study that households that are far from the forest are exposed to time delay, information asymmetry and not able to easily access benefit from the forest resource as compared to households near to the forest.
Number of livestock owned by the sample household respondents: The results in table 7 showed that about 48.9% (n=89) of the survey respondents owned between five to ten livestock per household while 25.8% (n=47) household head respondents had less than five livestock. However, about 25.3% (n=46) of the respondents owned more than ten livestock.
| Major source of fodder for livestock | Number of livestock the sample households owned | Total | ||||||||
| <5 | 10-May | >10 | ||||||||
| % | No | % | No | % | No | % | ||||
| Communal grazing land | 45 | 91.8 | 4 | 8.2 | 0 | 0 | 49 | 26.9 | ||
| The Dembiya natural forest | 2 | 3.1 | 63 | 96.9 | 0 | 0 | 65 | 35.7 | ||
| Own grazing land | 0 | 0 | 18 | 78.3 | 5 | 21.7 | 23 | 12.6 | ||
| Crop residue | 0 | 0 | 4 | 26.7 | 11 | 73.3 | 15 | 8.2 | ||
| Communal and Own grazing land |
0 | 0 | 0 | 0 | 14 | 100 | 14 | 7.7 | ||
| Own grazing land and crop residue |
0 | 0 | 0 | 0 | 10 | 100 | 10 | 5.5 | ||
| Other sources | 0 | 0 | 0 | 0 | 6 | 100 | 6 | 3.3 | ||
| Total | 47 | 25.8 | 89 | 48.9 | 46 | 25.3 | 182 | 100 | ||
Table 7: Distribution of households by livestock owned and major sources
of fodder.
Source: Field survey, 2015.
The respondents were also asked to give detail information regarding the main source of fodder for livestock they owned. About 35.7% (n=65) of the respondents replied that Dembiya woreda natural forest is the main source of fodder for rearing animals. While communal grazing land as a source of fodder took the second highest percentage (26.9%), the rest own grazing land, feed crop residue, communal and own grazing land, own grazing land and feed crop residue as well as other sources which were not listed here constituted, 12.6%, 8.2%, 7.7%, 5.5% and 3.3% respectively
In line with this animal resources have been playing an important role in influencing the socio-cultural life of the rural people. Even their relationship and dependency on community forestry has been largely determined by the size and number of their livestock holdings. As the people’s life is dependent on animal resources, they need fodder for feeding animals owing to which their interest in community forestry has been boosted. Thus, large number of livestock in the area has been causing forest resources degradation by over grazing as claimed in Tragedy of Commons by Hardin G [17].
It is displayed on table 8, out of the total households, the greater percentages (36.3% or n=66) of the respondents collected firewood or fuel-wood for energy from the forest. Based on the survey result, the second highest percentage of households is constituted by animal fodders collecting (12.1%). And bee keeping and edible plant collection activities on the one hand and medicinal plant collection and bush meat (hunting) constituted by 4.4% and 2.7% of households in each activity respectively. The remaining 6.6% and 6.0% of the respondents responded charcoal making and timber production for house construction as their type of forest products they harvested from the forest respectively. Therefore, a total of 75.3% of the respondents collected the type of forest products from Dembiya woreda natural forest. However, out of the total respondents, 24.7% (n=45) respondents were the part of analysis the Dembiy woreda natural community forest (Table 8).
| Types of products harvested | Frequency | Percent (%) |
| Fuel wood or fire wood collection | 66 | 36.3 |
| Beekeeping activities | 8 | 4.4 |
| Fodder collection for livestock | 22 | 12.1 |
| Charcoal making | 12 | 6.6 |
| Edible plants collection | 8 | 4.4 |
| Medicinal plants | 5 | 2.7 |
| Trees for house construction | 11 | 6 |
| Hunting or Bush meat | 5 | 2.7 |
| Total | 137 | 75.3 |
| Not part of the analysis | 45 | 24.7 |
| Total | 182 | 100 |
Table 8: Types of forest products collected from the Dembiya wereda
forest resource.
Source: Data collected from field survey, 2015.
Moreover, it could be seen that community dependence on the forest to a larger extent is for fuel-wood collection. The key informant interview held with the wereda agricultural and rural development forest management expert revealed that communities living in and near the forest are getting benefit from forest and forest product for themselves and for their animals. He also added that the most important initiating factor in forest management is the benefit that people getting from the forest resource (key informant interview, 2015). Similarly; Focus group discussion revealed that firewood is the main source of energy. In the FGDs, the respondents responded as “Majority of the people used firewood to cook the foods in everyday life. Forest is the main source of firewood, fodder, green grass, hubs, etc., for rural people. A Rural life cannot be imagined without a forest”. They also added that the supply of electricity and bio-gas in the study area are very poor and limited. Therefore, since there is no other alternative energy source aside fuel-wood, it is logical in the eyes of the local communities to use only fuel-wood for their energy consumption in the study area at the expense of forest cover.
Causes of Dembiya woreda natural forest destruction: The survey results of this study identified greater demand for charcoal making, fuel-wood collection, greater number of livestock, farm land expansion and population growth, unintentional bush burning, lack of community awareness, demand for house construction and inadequate forest legislation were the major causes of forest degradation in the study area. Figure 4 shows the percentage distribution of the survey respondents by the major causes of the Dembiya woreda natural forest resource degradation (Figure 4).
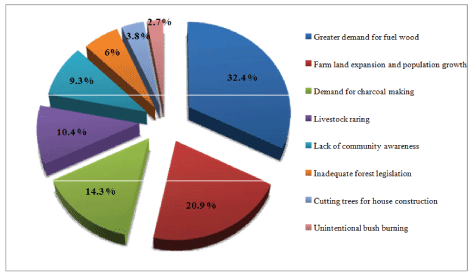
Figure 4: Major Causes of Forest Degradation in the Study Area (Survey, 2015).
According to the respondents, in the study area, fuel wood is the most common and major household energy source for home based activities like food cooking. Because of the lack of modern electric energy supply and bio-gas, the majority of the households are dependent on fuel wood for household cooking. From these stand point, out of the total sample survey respondents, about 32.4 percent replied that the greater demand of the people for fire wood as the main cause of forest degradation in the study area.
On the other hand, about 20.9 percent, 14.3 percent, 10.4 percent, 9.3 percent, 6 percent, 3.8 percent and 2.7 percent of the respondents identified expansion of agricultural land and population growth, demand for charcoal making, livestock raring, lack of community awareness (lack of awareness creation for the local communities regarding protection of the environment), inadequate forest legislation, cutting trees for house construction and unintentional bush firing were the major causes of forest degradation respectively.
A key informant (forest management expert) during data collection narrated as inadequacy of forest legislation as a cause of forest destruction. Key informant interviews held with local community development and forest management committee also mentioned scarcity of land, poor economic conditions and rapid population growth as other causes of forest destruction in the area. They also added that free roaming of livestock into the forest caused great damage to the forest in the area.
Teshome B [18] in his findings stated that the increasing demand for croplands, grazing land, construction poles and fuel wood including charcoal production are the main reason for the forest cover change in Ethiopia. In addition, forests are cleared to acquire constructional materials, to provide source of energy, to make space for grazing, farming and building and layout infrastructure networks and to supplement raw materials such as an input for agricultural production and livestock grazing [10].
Indicators of Dembiya woreda natural forest degradation: According to the information obtained from the respondents, disappearance of wild animals from the forest resource, actual loss of forest cover, decline of forest products like fuel wood, edible plants, fodder etc. and soil erosion in the forest were identified as the major perceived indicators of Dembiya woreda forest resource degradation (Table 9).
|
Perceived indicators of forest degradation in the area |
kebele name | Total | ||||||
| Gorgora | Gerargie | Atekelt teleft | ||||||
| No | % | No |
% | No | % | No | % | |
| Disappearance of wild animals | 10 | 15.6 | 12 |
19.7 | 11 | 19 | 33 | 18.1 |
| Loss of forest cover | 31 | 48.4 | 28 |
45.9 | 24 | 42 | 83 | 45.6 |
| Decline of forest products | 20 | 31.3 | 17 |
27.9 | 16 | 28 | 53 | 29.1 |
| Soil erosion in the forest | 3 | 4.7 | 4 |
6.5 | 6 | 11 | 13 | 7.1 |
| Total | 64 | 100 | 61 |
100 | 57 | 100 | 182 | 100 |
Table 9: Indicators of forest degradation in the study area.
Source: Field survey, 2015.
As shown in table 9, the greater number of respondents in all three kebele (Gorgora=48.4 percent, Gerargie=45.9 percent and Atekelt teleft=42 percent) perceived the actual loss of forest cover as the major indicator of forest resource degradation in the study area. This implies that out of the total samples, almost 45.6 percent of the respondents perceived forest cover loss. On the other hand, 31.3 percent, 27.9 percent and 28 percent of Gorgora, Gerargie, Atekelt teleft respondents respectively indicated as decline of forest products. The survey results also showed that 29.1 percent, 18.1 percent and 7.1 percent of the respondents identified decline of forest products, disappearance of wild animals and soil erosion respectively as sign of forest destruction in the study area. Accordingly the direct impact of the forest resource in Ethiopia was the creation of a wide gap between supply and demand for fuel wood, construction materials, timber and other forest products and further disappearance of the flora and fauna of the country. Indirectly, this has brought about a change in climate and the soil is exposed to desiccation and erosion, has to reduce land productivity [19,20].
The study revealed that the status and management of Dembiya woreda natural forest in the last 30 years was very much dense and the people were also responsible to manage it in proper and appropriate manner in the then time. However, the current forest status in the study area is very much degraded and the forest management is also very poor due to many reasons such as population growth, livestock raring, inadequate implementation of forest laws, etc. This implies that the forest is not currently managed properly and the management system is very poor.
This poor status of forest management in the area led to forest degradation and exploitation. The government did not give full legitimacy, practically, to the communities to manage the Dembiya woreda natural community forest. This poor level of community management would have negative impact on sustainable forest management because community participation is very essential for the proper management of forest resources. Therefore, policy makers and decision makers will get an insight from this output. Therefore, community participation in forest management is very essential for the proper management of forest resource. Therefore, communities should be encouraged to participate in different forest operational activities, like agro-forestry practices and occasional tree planting and hydroelectric supply in the rural setting and promoting the use of energy saving devices by the government are important.
Religions have role in forest resource conservation and this has to be studied how it can be integrated with community based conservations.
Download Provisional PDF Here
Article Type: RESEARCH ARTICLE
Citation: Gelaw AK, Tamiru SM (2019) Community Natural Forest Resource Dependency and its Degradation in Dembiya Woreda, Amhara National Regional State, Ethiopia. J Environ Toxicol Stud 3(2): dx.doi.org/10.16966/2576-6430.122
Copyright: © 2019 Gelaw AK, et al. This is an open-access article distributed under the terms of the Creative Commons Attribution License, which permits unrestricted use, distribution, and reproduction in any medium, provided the original author and source are credited.
Publication history:
All Sci Forschen Journals are Open Access