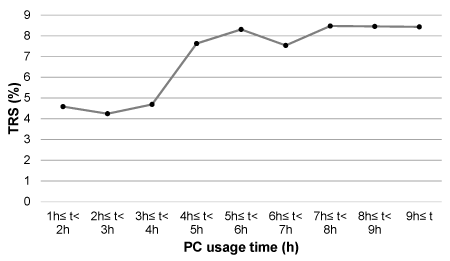
Figure 1: The distribution of temporomandibular disorders-related symptoms is dependent on duration of personal computer usage.
Abbreviations: PC: Personal Computer; TRS: Temporomandibular disorders-related symptoms

Kaori Tsukagoshi Akira Nishiyama* Masahiko Shimada
Orofacial Pain Management, Oral Health Sciences, Graduate School of Medical and Dental Sciences, Tokyo Medical and Dental University, Japan*Corresponding author: Akira Nishiyama, 1-5-45, Yushima, Bunkyo-ku, Tokyo 113-8549, Japan, Tel: +81-3-5803-5713; Fax: +81-3-5803-5713; E-mail: anishi.tmj@tmd.ac.jp
Objective: Visual display terminal work, such as using a personal computer, reportedly causes musculoskeletal symptoms and worsens mental health. Temporomandibular disorders, a type of musculoskeletal disorder, causes symptoms in the temporomandibular joint and masticatory muscles, and is linked to various factors. In this study, we conducted an employee survey to assess the relationship between the time spent working on a personal computer and the odds of reporting temporomandibular disorders-related symptoms.
Material and methods: A survey using a questionnaire was administered to employees of 4 companies. The questionnaire’s items addressed temporomandibular disorders-related symptoms, habitual behaviors, psychosocial factors, discomfort when maintaining a space between the upper and lower teeth, and daily personal computer usage time of over 1 h. The subjects were categorized as having temporomandibular disordersrelated symptoms or not having temporomandibular disorder-related symptoms based on their responses to questions on temporomandibular disorders. The relationships between temporomandibular disorders-related symptoms, personal computer usage time, and various contributing factors were analyzed using logistic regression analysis.
Results: The final number of subjects selected for the analysis was 4706; of these, 7.6% were categorized as having temporomandibular disorders-related symptoms. Logistic regression analysis showed that using a personal computer for 4 h/day or more was a significant factor of temporomandibular disorders-related symptoms.
Conclusions: Our survey assessing the relationship between personal computer usage time and the odds of reporting temporomandibular disorders-related symptoms showed that daily personal computer usage for 4 h or more significantly increased temporomandibular disordersrelated symptoms. This suggests that temporomandibular disorders-related symptoms may be strongly affected by daily personal computer usage, and these symptoms may manifest sooner than other pain-related symptoms, such as headache, neck pain, back pain, or shoulder pain.
Contributing factors; Musculoskeletal disorder; Non-functional tooth contact; Questionnaire
Temporomandibular disorders (TMD) are a subclass of musculoskeletal disorders resulting from dysfunctions of the stomatognathic system that affect the masticatory muscles, temporomandibular joint, and orofacial structures [1]. TMD is said to affect 5% to 12% of the general population [2,3]; hence, it is not a rare disease. The condition of TMD appears to be more common in women than in men. For most patients with TMD, discomfort from TMD will eventually dissipate with little or no treatment [4].
TMD is considered a multifactorial disorder, in which the accumulation of several contributing factors leads to onset of the condition [5]. Differences in the types and total number of contributing factors can affect the onset, exacerbation, chronicity, and recurrence of TMD. Numerous contributing factors have been reported, including trauma, anatomical factors, hormonal and genetic factors, parafunction and other habitual behaviors, and psychosocial factors [6-10]. Many studies have examined parafunctions and other habitual behaviors, and have found links to factors such as bruxism (during sleep and when awake), nail biting, and gum chewing [11-14]. Daytime tooth clenching, a form of awake bruxism, has received attention, but more recently, the focus has been on persistent tooth contact, which involves less force [10] than tooth clenching. Tooth contact involving only a weak force can be difficult to notice and may be maintained for long periods, placing stress on the masticatory muscles and temporomandibular joint [15,16]. Many studies have also found correlations with psychosocial factors, such as anxiety and depression, indicating that these may exacerbate TMD symptoms or contribute to their chronicity [10,17-20].
Visual display terminal (VDT) syndrome has also become a focus of attention recently. VDT is a general name for personal computer (PC) monitors and tablet screens. Working for long periods in front of these (i.e., VDT work) is thought to affect the body in various ways. Symptoms caused by VDT work can be physical or emotional. Physical symptoms include eye symptoms, such as dry eyes and eyestrain, and musculoskeletal symptoms, such as headache, neck pain, shoulder pain, back pain, and low back pain. Effects on mental health have also been reported, such as the worsening of anxiety and depressive states [21-25]. Collectively, these symptoms are referred to as VDT syndrome. Prolonged VDT work is thought to affect VDT syndrome markedly, with the risk of symptoms reported to increase when the working time exceeds 5 h [26].
TMD also presents with symptoms involving the musculoskeletal system, specifically, in the masticatory muscles and temporomandibular joint. As described above, psychosocial factors, such as anxiety or depression can affect the onset and chronicity of TMD. It can thus be surmised that TMD could be influenced by VDT work in some manner. Results from Nishiyama et al. [27] showed that each additional 2 h per day of PC usage time was associated with a 2.23-fold higher odd of reporting TMD related symptoms (TRS). However, the amount of VDT work required to increase the risk of TMD onset is unclear. In this study, we conducted a survey involving corporate employees who used a PC for more than 1 h per day to assess the relationship between the time spent working on a PC (i.e., VDT work) and the odds of reporting TRS.
The subjects were employees at 4 publicly listed companies in Tokyo and nearby prefectures. The companies were involved in the finance, telecommunications, and manufacturing sectors. The employees worked in sales, clerical, planning, service, specialized, technical, and creative jobs. A total of 5619 employees participated in the study. The mean age of these subjects was 39.0 ± 9.7 years and the number of women was 1655 (29.5%).
The survey was conducted in conjunction with health checks performed at each company from 2012 to 2014. The questionnaire used in the study was distributed together with the health-check guide. The subjects returned the completed questionnaires on the day of the health checks. We did not obtain written consent from each individual, as responding to and submitting the questionnaire was considered to indicate consent. This study was approved by the ethics committee of Tokyo Medical and Dental University (no. 325).
The questionnaire used in this study contained 21 items covering (1) sex and age, (2) symptoms of TMD (Q1−4), (3) frequency of contributing factors, (4) discomfort when maintaining a space between the upper and lower teeth, and (5) PC usage time (Table 1).
| Question items | Abbreviated form | |
| Q1 | If you open your mouth wide, is the opening range less than 3 fingers? | Limited mouth opening |
| Q2 | Do you experience pain in the face, jaw, temple, or in the front of the ear when you open and close your mouth? | Mouth-opening pain |
| Q3 | If you open your mouth wide, does the opening path deviate? | Mouth-opening deviation |
| Q4 | Do you experience pain in the face, jaw, temple, or in the front of the ear when you eat tough foods such as beef jerky, dried cuttlefish, or octopus? |
Chewing-induced pain |
| Q5 | Do you often chew gum? | Gum chewing |
| Q6 | Have you been warned about having bad posture? | Bad posture |
| Q7 | Do you engage in long conversations or phone calls? | Long conversations |
| Q8 | Do you chew food with only one side of your mouth? | Unilateral chewing |
| Q9 | Do you rest your chin on your hand? | Chin on their hand |
| Q10 | Do you bite your nails or chew on pencils? | Nail biting |
| Q11 | Do you experience stress at work, school, home, or in relationships? | Stress |
| Q12 | Do you experience anxiety at work, school, home, or in relationships? | Anxiety |
| Q13 | Do you experience depression at work, school, home, or in relationships? | Depression |
| Q14 | Do you experience tension at work, school, home, or in relationships? | Tension |
| Q15 | Do you experience jaw muscle fatigue or pain when you are awake? | Wake-up symptoms |
| Q16 | Do your upper and lower teeth make continuous contact during work or at rest? | Tooth contact |
| Q17 | Have you been warned about grinding your teeth in the past 3 months? | Grinding |
| Q18 | Do you feel uncomfortable when you maintain a space between the upper and lower dentition? | No freeway space |
| Q19 | How many hours do you use a personal computer per day? (h) | PC usage time |
Table 1: Questionnaire
The questions were rated as follows: Q1–4, 1) Not at all, 2) Rarely, 3) Difficult to say, 4) Frequently, or 5) Always;
Q5–17, 0) Not at all, 1) Rarely, 2) Sometimes, 3) Frequently, or 4) Always; Q18, No, Yes, or Neither.
PC: Personal Computer; Q: question.
TRS was assessed using a questionnaire developed by Sugisaki et al. [28] (screening questionnaire for TMD: SQ-TMD). The SQ-TMD is composed of 4 items, each of which is rated on a 5-grade scale. TRS is assessed based on the total score.
We referenced the results of several previous studies for the selection of the following 13 items (Q5−17) as contributing factors: gum chewing, bad posture, long conversations, unilateral chewing, resting the chin on the hand, nail biting, tooth contact when concentrating, indication of a grinding sound during sleep, symptoms upon waking, anxiety, depression, tension, and stress. The frequency of each factor was rated on a 5-grade scale.
The item pertaining to discomfort when maintaining a space between the upper and lower teeth (Q18) provided information regarding whether the subject felt discomfort when deliberately opening the mouth so that the upper and lower teeth were not touching. Q18 served to indirectly inquire about the existence of freeway space.
In terms of PC usage time (Q19), the subjects provided the actual average amount of time spent on a PC per day, at work. The survey did not enquire about time spent looking at tablet or smartphone screens.
Prior to the statistical analysis, the data we obtained were processed as follows. Based on a report by Sugisaki et al. [28], individuals with a total SQ-TMD score of 8 points or less were included in the non-TRS group and individuals with a score of 9 points or more were included in the TRS group. The frequency of contributing factors was converted to binary data, with low frequencies of 0 to 2 converted to “0” and high frequencies of 3 or 4 to “1.” Q18 was converted to binary data, with discomfort converted to “1” and other responses to “0.”
The values of each contributing factor evaluated were compared between the TRS and non-TRS groups, using a chi-square test. The factors that may have influenced TRS were estimated by logistic regression analysis using odds ratios (OR) and 95% confidence intervals as measures of association, using TRS as the dependent variable (non-TRS, 0; TRS,1) and other items as the independent variables (low frequency, 0; high frequency, 1). The covariates were entered into the logistic regression analysis by a stepwise forward technique with P<0.05 considered to be statistically significant. All statistical analyses were performed using the Statistical Package for Social Sciences (SPSS version 24.0, Tokyo, Japan).
Of the 5619 respondents, 843 (15.0%) had missing data and were excluded from the analysis, and 70 (1.2%) had PC usage time of less than 1 h per day. Finally, 4706 subjects (83.8%) were included in the analysis. The mean age of these subjects was 38.6 ± 9.4 years. They comprised 1389 women (29.5%), and 360 people were assessed as having a TRS (7.6%; Table 2).
| Item | Total | non-TRS | TRS | P value |
| Number: n (%) | 4706 (100) | 4346 (92.4) | 360 (7.6) | |
| Age:y (± SD) | 38.6 (± 9.4) | 38.8 (± 9.4) | 35.7 (± 9.1) | <0.001*a |
| Women: n (%) | 1389 (29.5) | 1213 (27.9) | 176 (48.9) | <0.001*b |
| PC usage time: h (± SD) | 6.4 (± 2.6) | 6.3 (± 2.6) | 6.7 (± 2.4) | 0.014*a |
Table 2: Demographic data of the 4706 subjects included in this study
PC: Personal Computer; SD: Standard Deviation; TRS: Temporomandibular disorders-related symptoms
a t-test; b chi-squared test; *statistically significant (P<0.05)
Table 3 shows the results of a comparison between the TRS and nonTRS groups for Q5−Q17. There was no significant difference in Q5 (gum chewing) and Q11 (nail bite). Figure 1 shows the rate of TRS for each of the 9 segments of PC usage time. There was a large difference between <4 h and ≥ 4 h. Therefore, PC usage time was converted into binary data with a cut-off value of 4 h for the logistic regression analysis.
Figure 1: The distribution of temporomandibular disorders-related symptoms is dependent on duration of personal computer usage.
Abbreviations: PC: Personal Computer; TRS: Temporomandibular disorders-related symptoms
| Item | non-TRS N=4346 | TRS N=360 | P value |
| Gum chewing (%) | 886 (20.3) | 79 (21.9) | 0.482 |
| Bad posture (%) | 888 (20.4) | 118 (32.8) | <0.001* |
| Long conversations (%) | 627 (14.4) | 70 (19.4) | 0.010* |
| Unilateral chewing (%) | 1324 (30.5) | 188 (52.2) | <0.001* |
| Resting their chin on their hand (%) | 892 (20.5) | 122 (33.9) | <0.001* |
| Nail biting (%) | 186 (4.3) | 19 (5.3) | 0.373 |
| Stress (%) | 1006 (23.1) | 123 (34.2) | <0.001* |
| Anxiety (%) | 682 (15.7) | 102 (28.3) | <0.001* |
| Depression (%) | 370 (8.5) | 64 (17.8) | <0.001* |
| Tension (%) | 1027 (23.6) | 137 (38.1) | <0.001* |
| Wake-up symptoms (%) | 101 (2.3) | 32 (8.9) | <0.001* |
| Tooth contact (%) | 1375 (31.6) | 139 (38.6) | 0.006* |
| Grinding (%) | 356 (8.2) | 47 (13.1) | 0.002* |
| No freeway space (%) | 402 (9.2) | 52 (14.4) | 0.001* |
Table 3: Comparison of each item according to TRS (chi-squared test)
TRS: Temporomandibular disorder-related symptoms
*statistically significant (P<0.05)
Table 4 shows the results of the logistic regression analysis. The independent variables were age, sex, Q6−9, and Q11−18. A significant correlation with TRS was observed for age (OR=0.99), sex (OR=1.84), bad posture (OR=1.41), unilateral chewing (OR=2.01), tension (OR=1.43), wake-up symptoms (OR=2.64), no freeway space (OR=1.75), and PC usage time (OR=1.49).
| Dependent value | Odds ratio | 95% CI | P value |
| Age | 0.99 | 0.97–1.00 | 0.023* |
| Female | 1.84 | 1.44–2.34 | <0.001* |
| Bad posture | 1.41 | 1.10–1.80 | 0.006* |
| Unilateral chewing | 2.01 | 1.60–2.52 | <0.001* |
| Tension | 1.43 | 1.13–1.81 | 0.003* |
| Wake-up symptoms | 2.64 | 1.71–4.06 | <0.001* |
| No freeway space | 1.75 | 1.18–2.59 | 0.005* |
| PC usage time ≥ 4h | 1.49 | 1.04–2.15 | 0.031* |
Table 4: Results of the logistic regression analysis
CI: Confidence Interval; PC: Personal Computer
*statistically significant (P<0.05)
In this study, we examined the relationship between TRS and time spent using a PC among corporate employees. This was a cross-sectional study, and a questionnaire was used for the assessment. SQ-TMD was used for the determination of TRS. The sensitivity, specificity, and falsepositive rate of the SQ-TMD are 0.746, 0.811, and 0.189, respectively [28]. A study that compared the findings of the SQ-TMD to diagnoses using the research diagnostic criteria for TMD (RDC/TMD) found a true-positive ratio of 0.816 [29]. The results showed that 7.6% of the subjects had TRS and that working on a PC for 4 h or more may increase TRS.
The proportion of TRS subjects in this study was 7.6%. According to the World Health Organization (WHO), the prevalence of TMD is 5% to 12% [4,30], and our results were within this range. However, few of the studies in the WHO report followed the DC/TMD, which is the current international standard; thus, the range of TMD prevalence may change marginally in the future.
The condition of TMD appears to be more common in women than in men [4]. In this study, the proportion of women in the TRS group was higher than that in non-TRS group.
Numerous studies have examined the correlations between musculoskeletal symptoms and VDT work. Musculoskeletal symptoms that accompany VDT work include headache, neck pain, shoulder pain, back pain, and low back pain. The probability of having these symptoms reportedly increases when the amount of VDT work exceeds 5 h [26]. However, in the present study, when we used a cutoff value of 4 h, PC usage time was found to be a significant factor. This indicates that the effects of PC usage time may be seen more rapidly in the development of TMD symptoms, such as joint pain, muscle pain, and limited mouth opening, than in other musculoskeletal disorders.
Since TMD is a disorder that presents with symptoms of the temporomandibular joint and masticatory muscles [1], it can also be considered a musculoskeletal disorder. VDT work has been shown to influence headache and neck and shoulder pain, which are symptoms involving areas close to the temporomandibular joint and masticatory muscles; thus, it is reasonable to consider that VDT work could also contribute to TMD symptoms. According to Horowitz and Sarkin [31], one reason for the high proportion of women among patients with TMD is because more women work on PCs. Furthermore, an online survey by Perri et al. [32] found that PC usage could affect TMD symptoms. Nishiyama et al. [27] reported a correlation between the time spent working on a PC and TMD. Their survey of 1969 corporate employees found that a 2-h increase in the duration of PC usage increased TRS 2 or 3 times.
Other factors that increased TRS were unilateral chewing, bad posture, tension, wake-up symptoms, such as tooth pain or facial pain, and the absence of free space between the upper and lower teeth.
Previous studies have indicated that unilateral chewing is a factor contributing to TMD [33]. Bad posture may also be related to PC usage. When operating a PC, the head moves forward, causing the upper body to adopt a forward-leaning posture; this may increase muscle tension in the shoulders and neck. Several studies have suggested a relationship between psychosocial factors and TMD. A survey of corporate employees by Nishiyama et al. [27] indicated that psychosocial factors exacerbated bruxism, and the force generated by bruxism could affect TRS. Their report also discussed the effects of contact (not clenching) between the upper and lower teeth when awake. The present study also extracted discomfort when maintaining a space between the upper and lower teeth as a significant factor in the development of TRS. Constant contact between the upper and lower teeth indicates that there is no free space when the mandible is at rest and that the upper and lower teeth are in constant contact. Sato et al. called this a “tooth contacting habit,” or constant contact between the upper and lower teeth, which does not involve clenching, and reported that it was related to TMD [16].
Furthermore, Michelotti et al. reported that the activity of the masticatory muscles was higher in the intercuspal position than at rest [34]. Continuous non-functional tooth contact is therefore thought to overload the temporomandibular joint and masticatory muscles. In fact, the association between clenching and muscle pain has been shown to be attributable to either muscle fiber damage or a reduction in the blood supply to the fibers, due to significantly lower perfusion of the masseter muscle [35-38]. Cheng et al. used a radiowave-activated wrist vibrator to show that patients with myofascial pain had an incidence of nonfunctional tooth contact during the day of nearly 4 times that of healthy controls [39]. Nicholson et al. demonstrated that scheduled-play increased EMG activity in the masseter muscle [40]. Additionally, Endo et al. [41] reported that daytime clenching was associated with anxious tendencies. Although this evidence is indirect, it appears possible that prolonged PC usage may promote clenching behavior or constant contact between the upper and lower teeth since VDT work contributes to the deterioration of mental health [21-26].
The individual factors extracted as significantly related to TRS in this study did not necessarily have high odds ratios (range: 1.41–2.64). However, since TMD is a multifactorial disorder, the accumulation of various contributing factors is thought to be the reason for the onset, persistence, exacerbation, and recurrence of TMD. Thus, even if individual factors do not have high odds ratios, they can have a large effect when they overlap. For example, the odds ratio for a woman with bad posture who works long hours on a PC and whom upper and lower teeth are in constant contact would be 6.76 (1.84 × 1.41 × 1.49 × 1.75), and thus may exhibit TRS. These contributing factors can be found in many corporate employees, and since VDT work environments are expected to continue to grow as tablets and smartphones become more common place, people who do VDT work will probably exhibit more TRS.
This research was a cross-sectional study that used a questionnaire. Therefore, TRS was assessed using a screening questionnaire, not an actual examination; therefore, the presence of TMD was not evaluated precisely. However, since the SQ-TMD has high sensitivity and specificity, and a large sample of approximately 5000 people was enrolled, the results are thought to approximate the outcomes of actual TMD assessments.
In this study, we examined the effects of PC time on TRS; however, to examine the correlation with VDT work overall, we would need to include tablets, smartphones, and other VDTs in the survey. In the future, more detailed surveys of VDT use that include not only work time, but also breaks and job types, should be conducted. Moreover, PC usage time of more 4 h per day is not the only factor that exacerbates TRS; for this study, we chose to examine 13 potential contributing factors of TRS. Yet, various habits and behaviors beside these 13 factors may contribute to the development of TRS.
This questionnaire-based study showed that reports of TRS were significantly increased among respondents with 4 h or more of PC work per day. Other contributing factors included constant contact between the upper and lower teeth and psychosocial factors.
We would like to thank all the workers who participated in the study, as well as the staff at each company’s health management office. We are also grateful to Dr. Shoko Tobe and Dr. Takenobu Ohta for helping to create the database.
This work was supported by JSPS KAKENHI (Grant-in-Aid for Scientific Research [C]) Grant Number: JP.23592837
The authors have no conflicts of interest to declare
Download Provisional PDF Here
Article Type: Research Article
Citation: Tsukagoshi K, Nishiyama A, Shimada M (2017) Association between Symptoms of Temporomandibular Disorders and Duration of Computer Use in a Working Population in Japan. Int J Dent Oral Health 3 (5): doi http://dx.doi.org/10.16966/2378-7090.243
Copyright: © 2017 Tsukagoshi K, et al. This is an open-access article distributed under the terms of the Creative Commons Attribution License, which permits unrestricted use, distribution, and reproduction in any medium, provided the original author and source are credited.
Publication history:
All Sci Forschen Journals are Open Access